Oregon Ranks Among Best Economies in US
Monday, June 06, 2016
Mass ranks 10th in economic activity, 9th in economic health and 13th in innovation potential.
The Rankings
Oregon ranks behind New York and Texas at 8 and 9 respectively, while ranking ahead of New Hampshire and Maryland at 11 and 12 respectively.
Utah ranks as the top economy, while Mississippi ranks as the worst economy.
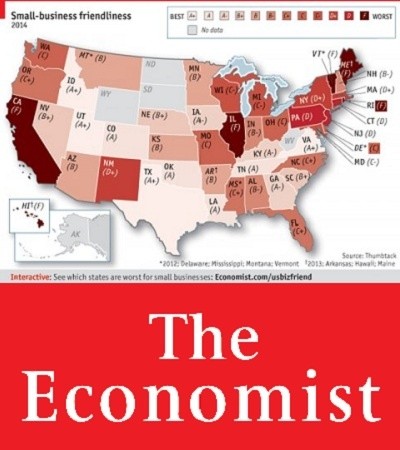
To see where the rest of the states rank, check out the map below.
The Method
To identify the best-performing state economies, WalletHub's analysts compared the 50 states and the District of Columbia across three key areas including economic activity, economic health and innovation potential.
WalletHub first identified 23 relevant metrics and gave them all a value between 0 and 100, 100 being the most favorable.
WalletHub calculated the overall score for each state using the weighted average across all metrics and ranked the states accordingly.
Economic Activity – Total Points: 40
- GDP Growth: Full Weight (~8.00 Points)
- Exports per Capita: Full Weight (~8.00 Points)
- Percentage of Fast-Growing Firms: Full Weight (~8.00 Points)
- Notes: This metric measures the number of firms in each state that are included on the “Technology Fast 500” list (Deloitte report) as a share of total firms in each state.
- Business-Startup Activity: Full Weight (~8.00 Points)
- Quality of State Legal System: Full Weight (~8.00 Points)
Economic Health – Total Points: 40
- Unemployment Rate: Full Weight (~3.64 Points)
- Nonfarm Payrolls Change: Full Weight (~3.64 Points)
- Civilian Labor-Force Change: Full Weight (~3.64 Points)
- Median Annual Household Income: Full Weight (~3.64 Points)
- State-Government Surplus/Deficit per Capita: Full Weight (~3.64 Points)
- Unfunded Liability (Public Pension Plans) per Capita: Full Weight (~3.64 Points)
- Percentage of Population Lacking Health Insurance: Full Weight (~3.64 Points)
- Percentage of Residents Living Below Poverty Level: Full Weight (~3.64 Points)
- Foreclosure Rate: Full Weight (~3.64 Points)
- Immigration of U.S. Knowledge Workers (Average Educational Attainment of Recent Migrants from Abroad): Full Weight (~3.64 Points)
- Notes: The educational attainment of recent immigrants aged 25 and older from abroad (“moved from a different country”) is classified as having either no high school diploma, a high school diploma (or equivalency), some college experience or an associate’s degree, a bachelor’s degree, or a graduate or professional degree. Each degree class was assigned a weight based on the equivalent average years of schooling the U.S. education system would require for the level of educational attainment:
- 0 for no high school diploma,
- 12 for high school diploma,
- 14 for some college experience or an associate’s degree,
- 16 for a bachelor’s degree, and
- 18.95 for a graduate or professional degree (the average number of years of schooling of the U.S. population of graduate, professional, and doctorate degree holders)
- The number of recent immigrants in each education class was multiplied by its respective weight then divided by the total number of recent immigrants aged 25 and older for the final score.
- Migration of U.S. Knowledge Workers (Average Educational Attainment of Recent Migrants from Other U.S. States): Full Weight (~3.64 Points)
- Notes: The educational attainment of recent migrants aged 25 and older from other states within the U.S. (“moved from a different state”) is classified as having either no high school diploma, a high school diploma (or equivalency), some college experience or an associate’s degree, a bachelor’s degree, or a graduate or professional degree. Each degree class was assigned a weight based on the equivalent average years of schooling the U.S. education system would require for the level of educational attainment:
- 0 for no high school diploma,
- 12 for high school diploma,
- 14 for some college experience or an associate’s degree,
- 16 for a bachelor’s degree, and
- 18.95 for a graduate or professional degree (the average number of years of schooling of the U.S. population of graduate, professional, and doctorate degree holders)
- The number of recent immigrants in each education class was multiplied by its respective weight then divided by the total number of recent immigrants aged 25 and older for the final score.
Innovation Potential – Total Points: 20
- Percentage of Jobs in High-Tech Industries: Full Weight (~2.86 Points)
- Percentage of Jobs Held by Scientists and Engineers: Full Weight (~2.86 Points)
- Number of Independent-Inventor Patents per 1,000 Working-Age Residents: Full Weight (~2.86 Points)
- Industry R&D Investment Amount per Total Civilian Employed Population: Full Weight (~2.86 Points)
- Nonindustry R&D Investment Amount as a Percentage of GDP): Full Weight (~2.86 Points)
- Venture-Capital Funding per Capita: Full Weight (~2.86 Points)
- Entrepreneurial Activity: Full Weight (~2.86 Points)
Related Slideshow: Oregon Business Rankings in US
See how Oregon stacked up against the other states in the U.S.
Related Articles
- Oregon’s Biggest Political ‘Turkeys’ of the Year
- Oregon’s LGBT Governor Silent on Indiana Law
- Oregon’s Luke Ridnour Traded 4 Times Within 7 Days
- Oregon’s Seven Best Winter Warmer Ales
- Oregon’s Pay Per Milage Program Offers Alternative to Gas Tax
- Oregon’s Students With Disabilities Significantly Less Likely To Graduate
- Oregon’s Tougher GED Means Bigger Profits for Test Prep Companies
- Oregon’s Vaccine Exemption Rate Drops 17 Percent
- Oregon’s Uncollected Revenue Up 50 Percent to $3.2 Billion
- Oregon’s Paluso Honored at White House
- Oregon’s No Road Salt Policy Could Cost $40 Million a Day in Lost Productivity
- Oregon’s Millionaires and Big Earners Bring in Millions in Unemployment
- Oregon’s Mark Helfrich is Pac-12’s Fourth Highest Paid Coach
- Oregon’s Minimum Wage to Rise by 15 Cents
- Oregon’s Most Devastating Sports Injuries
- Oregon’s NCAA Tournament Run Ends With Loss to Oklahoma
- Oregon’s 50 Most Violent Cities
- Oregon’s 20 Best Jobs That Don’t Require A College Degree
- Oregon Wins 19 Ribbons at Annual Cheese Competition
- Oregon Winning Fight Against Sex Trafficking of Minors
- Oregon Woman who Married 14 Military Men Wanted for Cross-Country Fraud Spree
- Oregon Workers to Receive Historic $2.4 Million Settlement with Daimler Trucks
- Oregon Zoo Announces Lion Cub Names
- Oregon Youth Leagues: It’s OK to Keep Score
- Oregon Wine Industry Reports “Exceptional” Harvest
- Oregon Wine Industry Largely White-Dominated: How It’s Changing
- Oregon Voters Narrowly Defeat GMO Labeling, Measure 92
- Oregon Voters Rejecting Political Parties
- Oregon Vs Arizona: Why All Eyes Are On Autzen
- Oregon Will Receive Nearly $6 Million for AmeriCorps
- Oregon Zoo Announces Summer Concert Lineup
- Oregon Zoo Celebrates Owl Awareness Day


Follow us on Pinterest Google + Facebook Twitter See It Read It