Welcome! Login | Register
 

Derek Jeter, Kobe Bryant, Tom Brady … Russell Wilson?—Derek Jeter, Kobe Bryant, Tom Brady … Russell…

U.S. Unemployment Claims Soar to Record-Breaking 3.3 Million During Coronavirus Crisis—U.S. Unemployment Claims Soar to Record-Breaking 3.3 Million…

Harlem Globetrotters Icon Fred “Curley” Neal Passes Away at 77—Harlem Globetrotters Icon Fred “Curley” Neal Passes Away…

Boredom Busters – 3 Games The Family Needs While The World Waits For Sports—Boredom Busters – 3 Games The Family Needs…

REPORT: 2020 Olympics to be Postponed Due to Coronavirus Emergency—REPORT: 2020 Olympics to be Postponed Due to…

Convicted Rapist Weinstein Has Coronavirus, According to Reports—Convicted Rapist Weinstein Has Coronavirus, According to Reports

“Does Anyone Care About Politics Right Now?”—Sunday Political Brunch March 22, 2020—“Does Anyone Care About Politics Right Now?” --…

U.S. - Canada Border to Close for Non-Essential Travel—U.S. - Canada Border to Close for Non-Essential…

Broken Hearts & Lost Games – How The Coronavirus Affected Me—Broken Hearts & Lost Games – How The…

White House Considering Giving Americans Checks to Combat Economic Impact of Coronavirus—White House Considering Giving Americans Checks to Combat…


Portland’s Urban Growth Boundary Could Force the City to Go Taller

Wednesday, April 08, 2015


Residents might call them sore thumbs on the skyline, while developers see them as pillars of currency. Either way, the question of taller buildings cannot be avoided when trying to solve Portland’s increasing density.

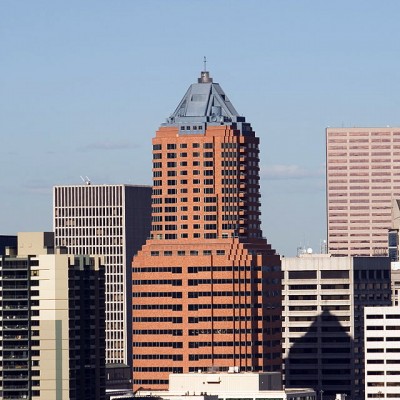
Today, the majority of high rises are located in Portland’s west quadrant, ranging from 15 stories upwards to 42. 

With Portland’s push towards high density, matched with an exceeding housing shortage, the central city could make room for more high rises at the hands of opportunistic investors.

Last summer, the Portland Bureau of Planning and Sustainability (BPS) initiated the West Quadrant Plan, which seeks to guide future investment and development to the area. 

The Lloyd District, across the river to the east, is also exploding with development, according to the BPS.

“There’s a lot of interest from the development community being able to build taller buildings,” said Mark Raggett, senior planner at BPS. “The central city of Portland is the only place in the state where you can build to 200 or 300 feet.”

By BPS definition, a high rise in the central city of Portland is a building over 15 stories. 

Five high rises are currently under construction, which includes four residential buildings and the Park Avenue West Tower, designated for commercial office space, ground floor retail and apartments. When completed, the skyscraper will be the fourth tallest building in the Rose City at 504 feet.

Raggett said Portland’s interest in taller buildings in the downtown area helps maintain the city’s urban growth boundary. It also reduces pressure on suburban areas and natural habitats outside the boundary. 

And unlike lower, squat buildings that cover more area, tall buildings allow room for plazas and small public spaces, according to the BPS.

Sky’s the Limit

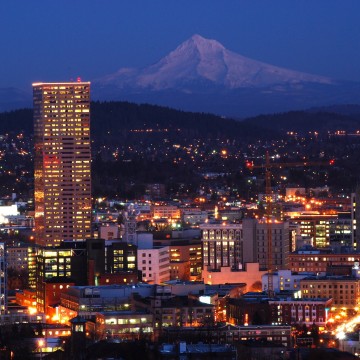
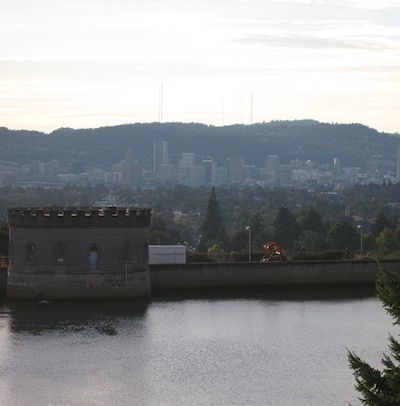
In the late 1980s, Portland made strides to preserve and protect its public views of Mt. Hood from the shadows of high rises. 

Adding to that, the City’s intentions were to build on a smaller scale, from the center outward, to maintain the attractiveness of sights along the Willamette River. 

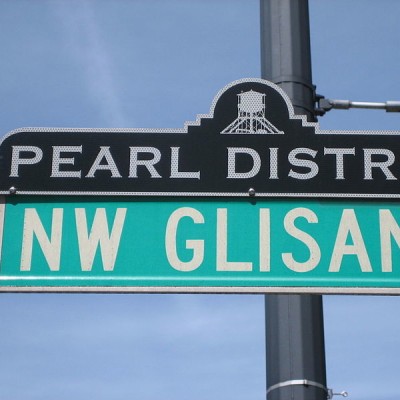
By the late 1990s, downtown residential living had become an emerging market, led first by the development of the Pearl District.

But as more people moved downtown, it seems they didn’t expect as many newer, larger buildings to pop up around them.

“We’re hearing a lot of concerns about the character of new developments and what that means to the skyline of the central city, also to the streetscape, and impacts on social isolation,” said Raggett. “Those concerns are largely coming from a population of downtown residents.”

Before the 1988 City Central Plan, Portland’s limit on height hit 460 feet. These days, in the Pearl and Lloyd districts, that number is unlimited. 

Vanessa Sturgeon, president and CEO of TMT Development Company, the force behind Park Avenue West Tower, believes that Portland’s skyline is perfectly suited for high-rise development. 

And in fact, the urban growth boundary has only motivated her company to be more creative in its development, she said. 

“We have to be more conscious about density because we don’t have the ‘easy out’ that sprawl provides,” said Sturgeon. “Our urban growth boundary is one reason so many institutional investors have been attracted to Portland, it makes downtown a safe bet for investment. The more stakeholders the better.”

For Gerard Mildner, associate professor of Real Estate Finance at Portland State University, his concern lies with the additional costs of higher density.

He said the City has targeted some of Portland’s cheapest areas, like Gateway and 82nd Street, for high-rise living. If that were to happen, rents would continue to increase drastically across the city.

“I don’t have a problem with high density,” said Mildner. “But to make the assumption that high rises are going to be the bulk of our housing for the next 20 years I think is insane.”

Vertical Sprawl 

Michael Mehaffy is an urban development consultant and a resident of Portland’s west side. 

What troubles him is vertical sprawl, which he says can damage walkable, human-scale urban communities. Also, the aesthetic impact of a building is greatly magnified by its towering height. 

“Tall buildings are, in affect, a type of vertical gated community,” said Mehaffy, who also dismisses the argument that high rises are an efficient and “more green” way to develop.

And while high rises might have their purpose, they’re definitely not a silver bullet answer to combat sprawl, believes Mehaffy. On the contrary, he said low and mid-rise buildings get better results regarding urban density and “compactness.”

“This wave of capital that’s surging into our city can be managed with tools that don’t allow a new generation of very damaging buildings to be built in our core,” he said.

Tall buildings also have negative social impacts on city residents, argues architect Suzanne Crowhurst Lennard, founder of the International Making Cities Livable Conferences.

“High rise buildings create inequality and un-livability,” said Lennard. “They increase land prices so rapidly that the poor and middle classes are quickly displaced.”

“If Portland planners and elected officials continue to push high-rises through,” continued Lennard, “our city will quickly lose its unique livability and become as unaffordable as Vancouver, B.C., New York, and Hong Kong.”

Should The Boundary Be Broken?

Portland should not have to choose between outward or upward, according to Suzanne Crowhurst Lennard. 

She said documentation shows, “enough available land, for example in parking lots, to accommodate all necessary growth without breaking the urban growth boundary or building high rises.”

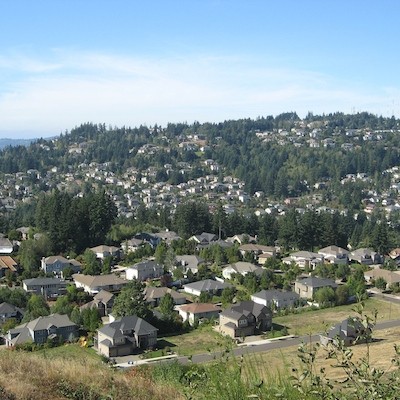
Gerard Mildner is a little more eager to question the boundary, by looking toward additional suburban development, like urban reserves in Washington County, which would not necessarily embrace sprawl. 

“We know we’re going to be expanding the urban growth boundary sometime over the next 20 years,” said Mildner. 

“Frankly, I think we should be doing it today, because it will take those urban reserves 10 years to plan for that growth, and it’ll take some of the heat off the current housing market.” 

Melanie Sevcenko is a journalist for radio, print and online. She reports internationally for BBC World Service and Monocle Radio (M24) in the UK, and for Deutsche Welle in Germany. Melanie also reports for the online news source GoLocalPDX, in Portland, Oregon. Her work has been broadcast by CBC in Canada and the Northwest News Network, and published by Al Jazeera English, Global Post, Pacific Standard, the Toronto Star and USA Today, amongst others.


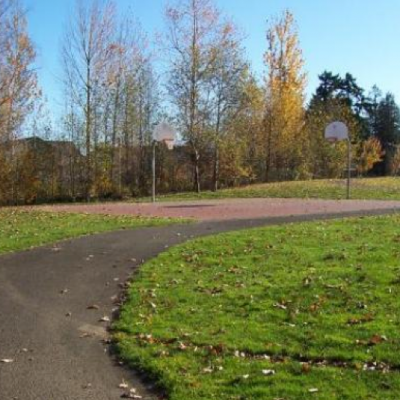
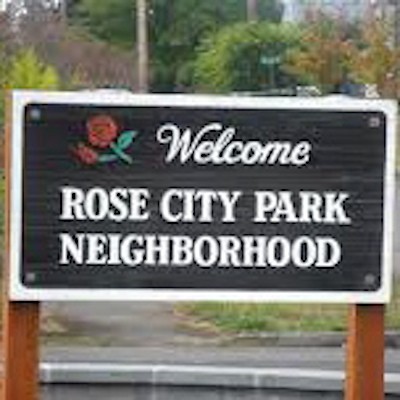
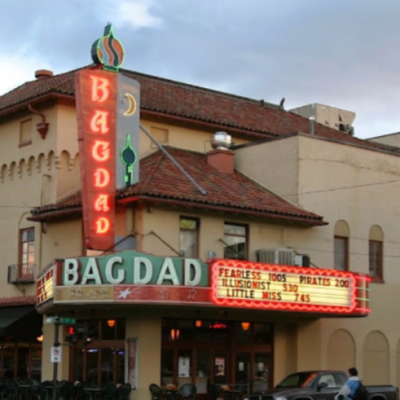
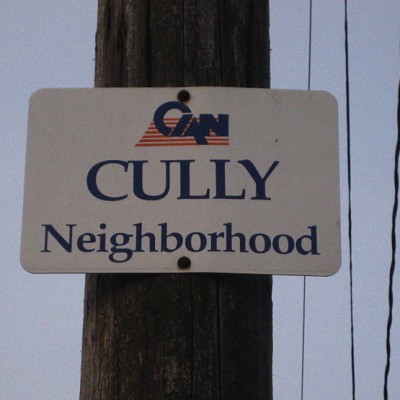
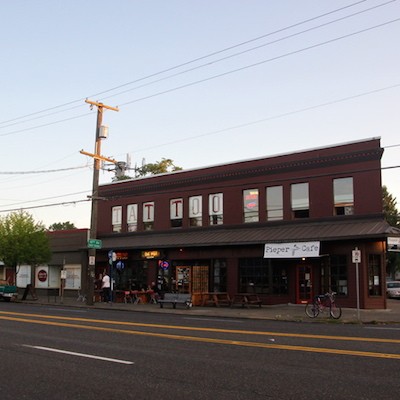
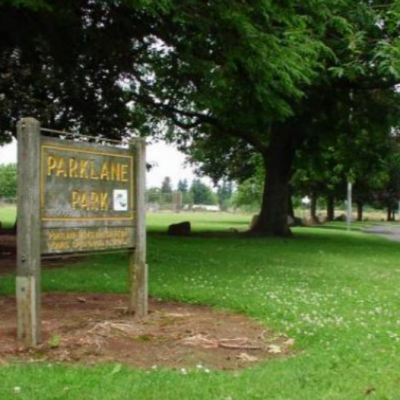
Related Slideshow: Portland’s 20 Hottest Neighborhoods for Real Estate

What are Portland’s hottest neighborhoods for real estate? The 20 neighborhoods below are ranked by the number of sold homes over the last 90 days. The information, along with the median list price and median price per square foot, comes from the real estate company Redfin. The population is from 2010 census data. 

The sale to list percentage, also from Redfin, is the final selling price over what the listed price was, to show how close sellers came to their asking price. In cases where it is over 100 percent, the seller got more than then listed price. 

Find out what the hottest real estate neighborhoods in Portland are: 

Prev Next

#20 (tied)

Wilkes  

# of Homes Sold Over the Last 90 Days: 34

Median List Price: $259,925

Median Price Per Square Foot: $143

Sale to List Percentage: 98.1%

Population: 8,775

Note: Sale to List Percentage shows how close the sale price was to the listed price.

Prev Next

#19 (tied)

Rose City Park

# of Homes Sold Over the Last 90 Days: 34

Median List Price: $489,700

Median Price Per Square Foot: $287

Sale to List Percentage: 98.3%

Population: 8,982

Note: Sale to List Percentage shows how close the sale price was to the listed price.

Prev Next

#18 (tied)

Richmond

# of Homes Sold Over the Last 90 Days: 34

Median List Price: $497,000

Median Price Per Square Foot: $345

Sale to List Percentage: 98.9%

Population: 11,607

Note: Sale to List Percentage shows how close the sale price was to the listed price.

Prev Next

#17

Downtown

# of Homes Sold Over the Last 90 Days: 36

Median List Price: $394,500

Median Price Per Square Foot: $442

Sale to List Percentage: 97.5%

Population: 12,801

Note: Sale to List Percentage shows how close the sale price was to the listed price.

Prev Next

#16 (tied)

Mount Tabor

# of Homes Sold Over the Last 90 Days: 38

Median List Price: $574,900

Median Price Per Square Foot: $356

Sale to List Percentage: 99.2%

Population: 10,162

Note: Sale to List Percentage shows how close the sale price was to the listed price.

Prev Next

#15 (tied)

Cully

# of Homes Sold Over the Last 90 Days: 38

Median List Price: $235,000

Median Price Per Square Foot: $180

Sale to List Percentage: 100.3%

Population: 13,209

Note: Sale to List Percentage shows how close the sale price was to the listed price.

Prev Next

#14 (tied)

Mount Scott-Arleta

# of Homes Sold Over the Last 90 Days: 39

Median List Price: $249,974

Median Price Per Square Foot: $178

Sale to List Percentage: 98.7%

Population: 7,397

Note: Sale to List Percentage shows how close the sale price was to the listed price.

Prev Next

#13 (tied)

Concordia

# of Homes Sold Over the Last 90 Days: 39

Median List Price: $249,974

Median Price Per Square Foot: $178

Sale to List Percentage: 98.7%

Population: 9,550

Note: Sale to List Percentage shows how close the sale price was to the listed price.

Prev Next

#12 (tied)

St. Johns

# of Homes Sold Over the Last 90 Days: 42

Median List Price: $234,925

Median Price Per Square Foot: $164

Sale to List Percentage: 97.6%

Population: 12,207

Note: Sale to List Percentage shows how close the sale price was to the listed price.

Prev Next

#11 (tied)

Corbett

# of Homes Sold Over the Last 90 Days: 42

Median List Price: $574,950

Median Price Per Square Foot: $361

Sale to List Percentage: 98.2%

Population: 7,088

Note: Sale to List Percentage shows how close the sale price was to the listed price.

Prev Next

#10

Portsmouth

# of Homes Sold Over the Last 90 Days: 43

Median List Price: $225,000

Median Price Per Square Foot: $172

Sale to List Percentage: 101.1%

Population: 9,789

Note: Sale to List Percentage shows how close the sale price was to the listed price.

Prev Next

#9

Mount Scott

# of Homes Sold Over the Last 90 Days: 44

Median List Price: $274,700

Median Price Per Square Foot: $185

Sale to List Percentage: 97.8%

Population (Mount Scott-Arleta): 7,397

Note: Sale to List Percentage shows how close the sale price was to the listed price.

Prev Next

#8

Centennial

# of Homes Sold Over the Last 90 Days: 50

Median List Price: $203,000

Median Price Per Square Foot: $153

Sale to List Percentage: 99.6%

Population: 23,662

Note: Sale to List Percentage shows how close the sale price was to the listed price.

Prev Next

#7

Pearl

# of Homes Sold Over the Last 90 Days: 51

Median List Price: $500,000

Median Price Per Square Foot: $445

Sale to List Percentage: 98.9%

Population: 5,997

Note: Sale to List Percentage shows how close the sale price was to the listed price.

Prev Next

#6

Beaumont

# of Homes Sold Over the Last 90 Days: 54

Median List Price: $699,900

Median Price Per Square Foot: $253

Sale to List Percentage: 101.3%

Population: 5,346

Note: Sale to List Percentage shows how close the sale price was to the listed price.

Prev Next

#5

Hazelwood

# of Homes Sold Over the Last 90 Days: 56

Median List Price: $225,000

Median Price Per Square Foot: $166

Sale to List Percentage: 98.3%

Population: 23,462

Note: Sale to List Percentage shows how close the sale price was to the listed price.

Prev Next

#4

Brentwood

# of Homes Sold Over the Last 90 Days: 58

Median List Price: $184,950

Median Price Per Square Foot: $161

Sale to List Percentage: 99.3%

Population (Brentwood-Darlington): 12,994

Note: Sale to List Percentage shows how close the sale price was to the listed price.

Prev Next

#3

Powellhurst-Gilbert

# of Homes Sold Over the Last 90 Days: 67

Median List Price: $214,950

Median Price Per Square Foot: $164

Sale to List Percentage: 97.9%

Population: 30,639

Note: Sale to List Percentage shows how close the sale price was to the listed price.

Prev Next

#2

Montavilla

# of Homes Sold Over the Last 90 Days: 67

Median List Price: $222,500

Median Price Per Square Foot: $201

Sale to List Percentage: 100%

Population: 16,287

Note: Sale to List Percentage shows how close the sale price was to the listed price.

Prev Next

#1

Brentwood-Darlington

# of Homes Sold Over the Last 90 Days: 81

Median List Price: $212,450

Median Price Per Square Foot: $178

Sale to List Percentage: 99.3%

Population: 12,994

Note: Sale to List Percentage shows how close the sale price was to the listed price.


Related Articles


Enjoy this post? Share it with others.


X

Stay Connected — Free
Daily Email