Armed School Guards Lack Mental Health Screening


 Email to a friend
Permalink
Email to a friend
Permalink
Monday, January 05, 2015
GoLocalPDX News Team
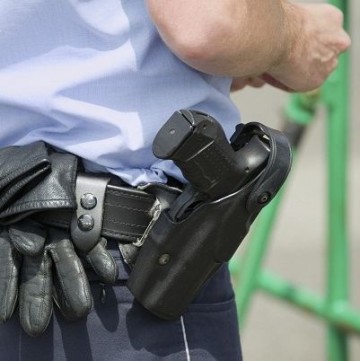
Armed security guards in Washington and Oregon are not required by the state to undergo mental health screenings. With at least six Washington school districts and employing private security and Oregon districts looking at options to beef up school security, critics are alarmed for the safety of schools.
In Oregon and Washington, private security guards are not required to take mental health or psychological tests to carry a firearm. Only four states—Pennsylvania, Oklahoma, New Mexico, and Delaware—legally require mental health screening, according to the Center for Investigative Reporting.
Professionals who work with firearms should undergo the proper screening to ensure safety, according to Phillip Zerzan, head of security at Portland State University and former state policeman.
“Anyone who has to make use-of-force decisions should be rigorously screened, including a thorough background investigation as well as psychological evaluations,” Zerzan said. “It’s very important.”
The lack of screening is gaining attention as private security guards are making their way into school systems.
“It disturbs me that a daycare worker can have higher standards than an armed security guard,” said Lisa Thurau-Gray, executive director of the police and youth interactions advocacy nonprofit Strategies for Youth. “I don’t think an unregulated force of folks who are armed in schools is in anyone's interest.”
Many schools across the U.S., such as Sandy Hook Elementary in Connecticut, have added armed security to their campuses after school shootings in recent years. Just within the past year, the Northwest has witnessed school shootings at Seattle Pacific University in Washington, as well as Reynolds High School and Rosemary Anderson High School in the Portland area.
In 2013, at least seven states had armed guards in schools. Kevin Starrett, director of the Oregon Firearms Federation, said that a handful of Oregon school districts have armed security, mostly in the form of police officers.
“It makes sense—schools are places that make appealing targets to a crazy or evil person,” Starrett said. “When it does happen, innocent people are totally defenseless. It’s foolish not to prepare.”
Joe Walden, legislative chairman for the Washington State Rifle and Pistol Association and former lobbyist, said armed personnel in schools is one solution to security problems.
“It’s a controversial issue on both sides,” Walden said. “But if it’s done right there’s more protection than risk.”
Portland State University will be adding armed police to its campus security over the next three years, and OHSU recently upgraded its security measures as well.
Budget Issues
However, Starrett said many rural districts do not have the resources to provide full time, or even any police presence on site. In this case, private security is a cost-effective option. Ridgefield School District in Clark County, Washington, switched to armed security guards in 2013 to increase security and save money.
Penny Okamoto, executive director of Cease Fire Oregon was alarmed at the idea that security at schools might come down to budget concerns.
“I would not want the security of my child based on what’s cheapest,” Okamoto said. “I would want a highly trained security person there.”
Although armed security traditionally comes in the form of police officers, many of Oregon’s more rural counties have limited manpower. The Grants Pass School District hires armed police security, but there is only one officer working half time for all nine schools, according to Sgt. Todd Moran with the Grants Pass Police.
Already some public places have switched to private armed protection. The Medford and Redmond airports hired security guards from the Northwest firm RAMS Security, instead of local law enforcement.
“We got those contracts because a police officer costs $40 to $50 an hour, while an armed security officer costs between $27 to $30 an hour,” said Dwayne Cole, regional manager for RAMS Security.
State Regulations
State requirements for private security training and screening are more lax compared to law enforcement. In Washington, armed security guards must undergo a background check and a firearm training course. However, there is no mental health screening.
The Oregon Department of Public Safety Standards and Training (DPSST) oversees regulated training and licensing for armed security. Under Oregon law, private security companies are required to check if their employees are certified by the DPSST program.
The DPSST conducts criminal background checks and sees if applicants have been committed to a mental health institution or have a recorded mental illness that legally prohibits them from owning a firearm. However, no mental health evaluations or psychological tests are performed. Even with the legal requirements, many private firms bypass the system altogether.
“We receive a fair amount of complaints, primarily about security companies or guards not in compliance with our regulations,” said Karen Evans, investigator with the DPSST.
In the three month period between July and September 2014, 11 violations were issued by the DPSST against security guards or companies working without required certification.
Security firms rarely conduct their own mental health screening, according to security professionals.
“Mental health screenings are extremely expensive,” Cole said. “Most companies, their profit margin doesn’t absorb that. You hear about companies saying, ‘We just need a warm body.’ They’re not going to be so picky.”
Guards in Northwest Schools
Security firm Phoenix Protective Corp has guards in Ridgefield, Mount Adams, White Swan, Toppenish, Wapato, and West Valley, Washington schools and has been working towards getting hired in Oregon schools, according to spokesman JC Shah. Shah said the company has an extensive application process, but no official mental health screening.
In Oregon, the Salem Keizer School District will contract armed security for after-hours patrols or special circumstances, according to Lt. David Okada with the Salem Police.
If more schools do make the switch to private security guards, police unions and state legislators may push for tighter regulations, according to Bruce McCain, a lawyer and retired captain for the Multnomah County Sheriff’s Office.
“Anytime the private sector muscles into the public sector, [the union] will make noise,” McCain said. “Unions don’t want to see police jobs farmed out to private firms and advocates in schools will be talking about how standing guard over children isn’t the same as a warehouse.”
Okamoto doesn’t believe armed guards are necessarily the answer. In the 1999 Columbine High School shooting, the on-campus police officer was essentially outgunned by shooters Eric Harris and Dylan Klebold, Okamoto said.
“At the Navy Yards shooting [in Washington D.C. in Sept. 2013], the first thing the shooter did was kill the guard,” Okamoto said.
She doesn’t like the idea of anyone coming onto a campus with a gun, whether they are security or not. Okamoto said rather than having a campus arms race, public policy should focus more on prevention.
“We should be talking about preventing minors from accessing weapons,” Okamoto said. “And let’s make sure we’ve got great mental health care, dare I say, free mental health care in this country.”
Related Slideshow: Oregon’s 50 Most Violent Cities
GoLocalPDX ranked Oregon's most violent cities based on the latest Federal Bureau of Investigation crime data from 2013. See if your city made the list.
Prev
Next
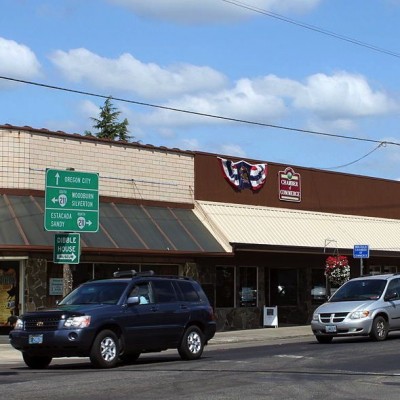
#50 Molalla
Violent Crime Per Capita per 1,000 residents: 1.328
Total Violent Crimes: 11
Population: 8,282
Murder: 0
Sexual Assault : 2
Robbery: 2
Aggravated Assaults: 7
Photo: Main Street in Molalla, via Wikimedia Commons
Prev
Next
#49 Hillsboro
Violent Crime Per Capita per 1,000 residents: 1.464
Total Violent Crimes: 141
Population: 96,313
Murder: 0
Sexual Assault: 29
Robbery: 55
Aggravated Assaults: 57
Interesting fact from the data: Hillsboro had a high number of larceny-theft cases last year, with 1,723 total cases.
Photo: Hillsboro, via Wikimedia Commons
Prev
Next
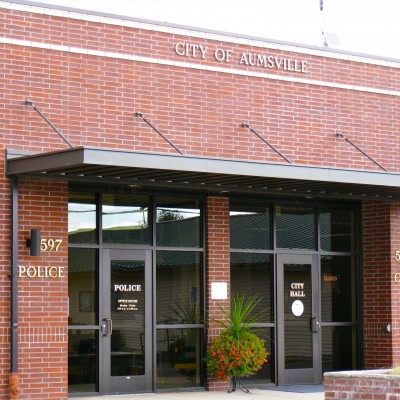
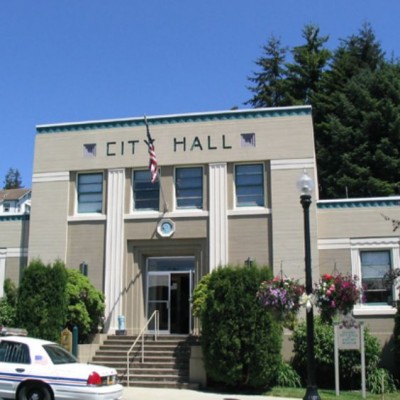
#48 Milwaukie
Violent Crime Per Capita per 1,000 residents: 1.465
Total Violent Crimes: 30
Population: 20,480
Murder: 0
Sexual Assault: 5
Robbery: 5
Aggravated Assaults: 20
Photo: Milwaukie city hall, via Wikimedia Commons
Prev
Next
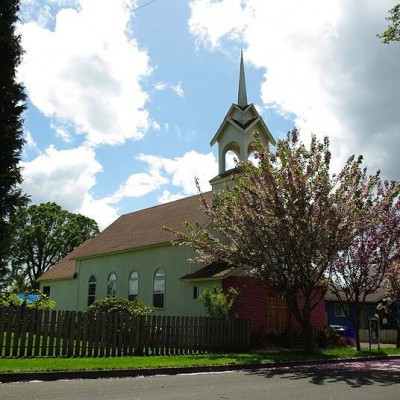
#47 Cornelius
Violent Crime Per Capita per 1,000 residents: 1.472
Total Violent Crimes: 18
Population: 12,231
Murder: 0
Sexual Assault: 4
Robbery: 9
Aggravated Assaults: 5
Photo: Church on South Beech St. in Cornelius, via Wikimedia Commons
Prev
Next
#46 Gaston
Violent Crime Per Capita per 1,000 residents: 1.504
Total Violent Crimes: 1
Population: 665
Murder: 0
Sexual Assault: 0
Robbery: 0
Aggravated Assaults: 1
Interesting fact from the data: Gaston only had 29 property crimes last year.
Photo: Gaston, via Wikimedia Commons
Prev
Next
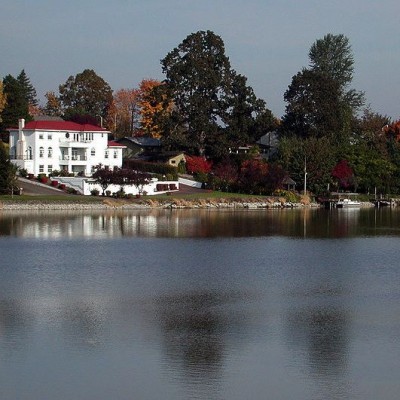
#45 Fairview
Violent Crime Per Capita per 1,000 residents: 1.518
Total Violent Crimes: 14
Population: 9,225
Murder: 1
Sexual Assault: 4
Robbery: 2
Aggravated Assaults: 7
Photo: Fairview Lake, via Wikimedia Commons
Prev
Next
#44 Rockaway Beach
Violent Crime Per Capita per 1,000 residents: 1.523
Total Violent Crimes: 2
Population: 1,313
Murder: 0
Sexual Assault: 0
Robbery: 0
Aggravated Assaults: 2
Interesting fact from the data: Rockaway Beach had no motor vehicle thefts last year.
Photo: Rockaway Beach, via Wikimedia Commons
Prev
Next
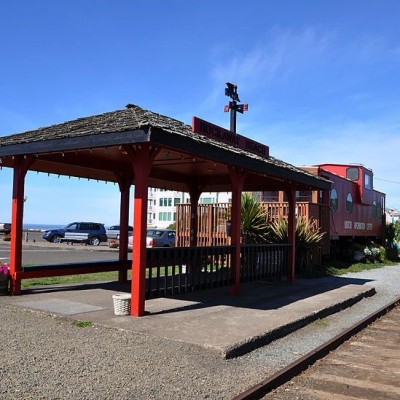
#43 Aumsville
Violent Crime Per Capita per 1,000 residents: 1.605
Total Violent Crimes: 6
Population: 3,738
Murder: 0
Sexual Assault: 0
Robbery: 1
Aggravated Assaults: 5
Photo: Aumsville, via waymarking.com
Prev
Next
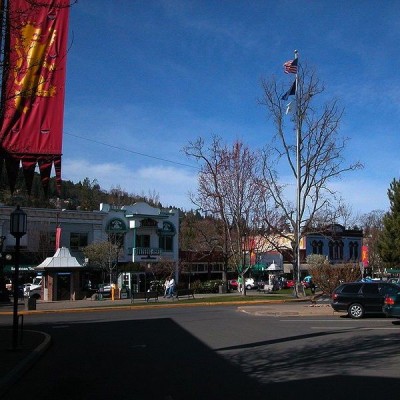
#42 Ashland
Violent Crime Per Capita per 1,000 residents: 1.613
Total Violent Crimes: 33
Population: 20,455
Murder: 0
Sexual Assault: 5
Robbery: 7
Aggravated Assaults: 21
Photo Credit: The Plaza in Ashland, via Wikimedia Commons
Prev
Next
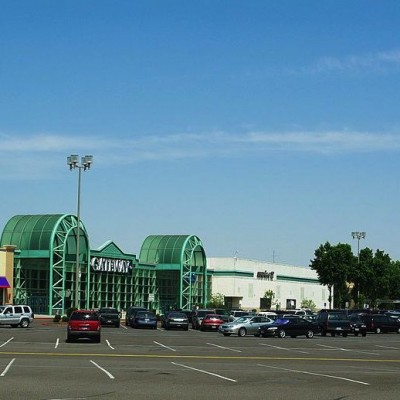
#41 Springfield
Violent Crime Per Capita per 1,000 residents: 1.633
Total Violent Crimes: 98
Population: 60,024
Murder: 2
Sexual Assault: 14
Robbery: 32
Aggravated Assaults: 50
Interesting fact from the data: There were 25 arson cases in Springfield last year.
Photo: Gateway Mall in Springfield
Prev
Next
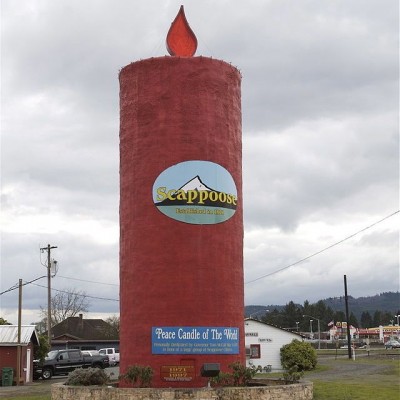
#40 Scappose
Violent Crime Per Capita per 1,000 residents: 1.647
Total Violent Crimes: 11
Population: 6,677
Murder: 0
Sexual Assault: 0
Robbery: 1
Aggravated Assaults: 10
Photo: The Peace Candle of Scappoose, via Wikimedia Commons
Prev
Next
#39 Keizer
Violent Crime Per Capita per 1,000 residents: 1.648
Total Violent Crimes: 61
Population: 37,018
Murder: 0
Sexual Assault: 8
Robbery: 7
Aggravated Assaults: 46
Photo: Keizer, via Wikimedia Commons
Prev
Next
#38 Cottage Grove
Violent Crime Per Capita per 1,000 residents: 1.838
Total Violent Crimes: 18
Population: 9795
Murder: 1
Sexual Assault: 0
Robbery: 5
Aggravated Assaults: 12
Photo: Cottage Grove historic district, via Wikimedia Commons
Prev
Next
#37 Umatilla
Violent Crime Per Capita per 1,000 residents: 1.847
Total Violent Crimes: 13
Population: 7,040
Murder: 0
Sexual Assault: 2
Robbery: 0
Aggravated Assaults: 11
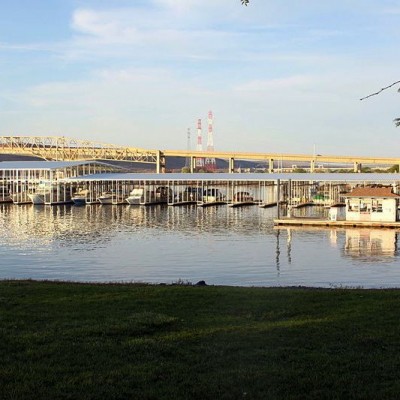
Photo: Umatilla Marina, via Wikimedia Commons
Prev
Next
#36 Central Point
Violent Crime Per Capita per 1,000 residents: 1.887
Total Violent Crimes: 33
Population: 17,485
Murder: 0
Sexual Assault: 5
Robbery: 4
Aggravated Assaults: 24
Photo: Central Point, via Wikimedia Commons
Prev
Next
#35 Lebanon
Violent Crime Per Capita per 1,000 residents: 1.898
Total Violent Crimes: 30
Population: 15,810
Murder: 0
Sexual Assault: 2
Robbery: 11
Aggravated Assaults: 17
Interesting fact from the data: Lebanon had 530 larceny-theft cases last year, almost five times more than their total burglary cases.
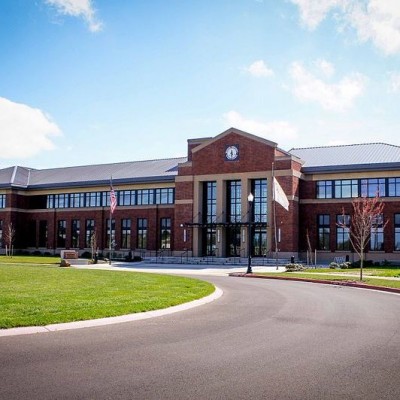
Photo: College of Osteopathic Medicine of the Pacific Northwest in Lebanon, via Wikimedia Commons
Prev
Next
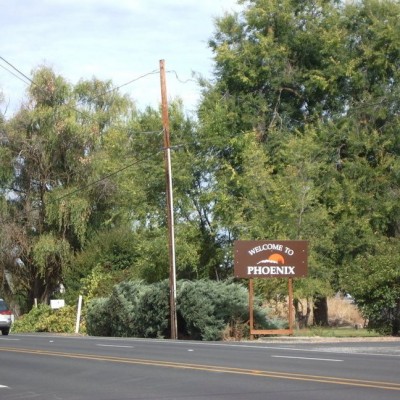
#34 Phoenix
Violent Crime Per Capita per 1,000 residents: 1.957
Total Violent Crimes: 9
Population: 4,600
Murder: 0
Sexual Assault: 2
Robbery: 3
Aggravated Assaults: 4
Photo: Phoenix welcome sign, via City-Data.com
Prev
Next
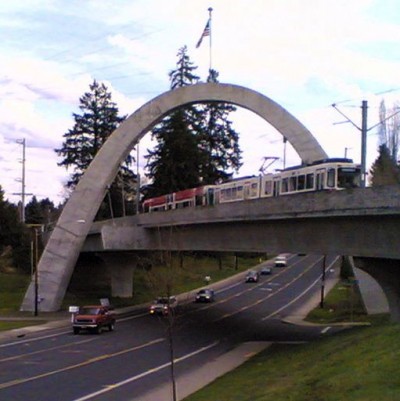
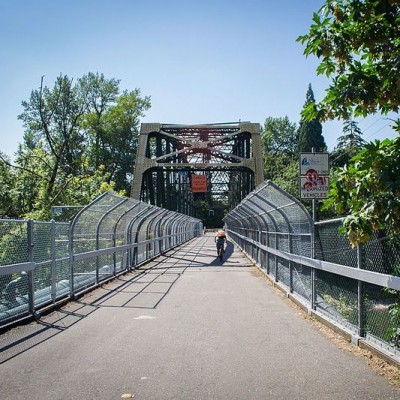
#33 Gladstone
Violent Crime Per Capita per 1,000 residents: 1.966
Total Violent Crimes: 23
Population: 11,699
Murder: 1
Sexual Assault: 5
Robbery: 1
Aggravated Assaults: 16
Photo: 82nd Dr. Pedestrian Bridge in Gladstone, via Wikimedia Commons
Prev
Next
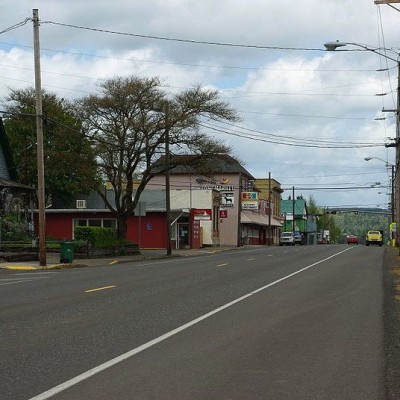
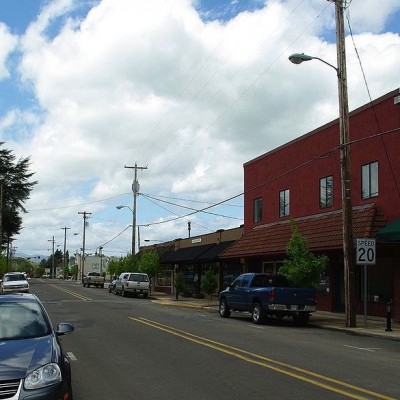
#32 Carlton
Violent Crime Per Capita per 1,000 residents: 1.978
Total Violent Crimes: 4
Population: 2,022
Murder: 0
Sexual Assault: 3
Robbery: 0
Aggravated Assaults: 1
Interesting fact from the data: Carlton had no cases of arson or motor vehicle theft last year.
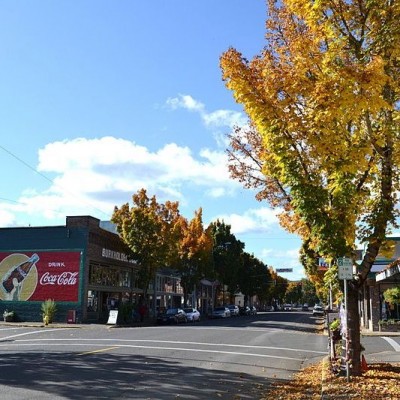
Photo: Main Street in Carlton, via Wikimedia Commons

Prev
Next
#31 Tillamook
Violent Crime Per Capita per 1,000 residents: 2.028
Total Violent Crimes: 10
Population: 4,932
Murder: 0
Sexual Assault: 1
Robbery: 4
Aggravated Assaults: 5
Photo: Tillamook Creamery via Wikimedia Commons
Prev
Next
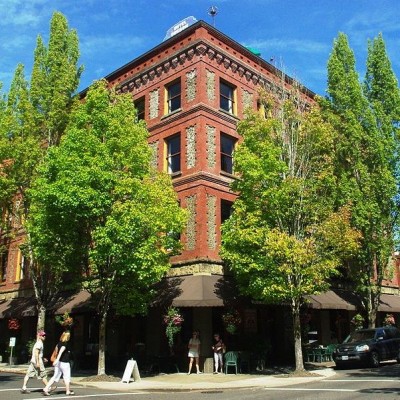
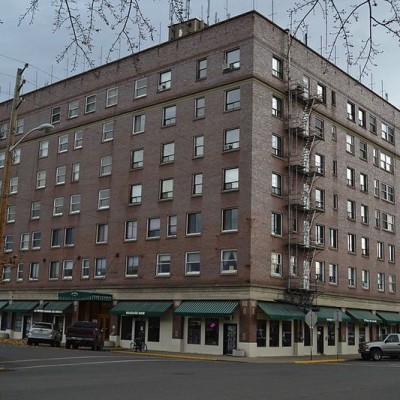
#30 McMinnville
Violent Crime Per Capita per 1,000 residents: 2.083
Total Violent Crimes: 68
Population: 32,642
Murder: 1
Sexual Assault: 17
Robbery: 15
Aggravated Assaults: 35
Photo: Hotel Oregon in the Downtown Historic District
Prev
Next
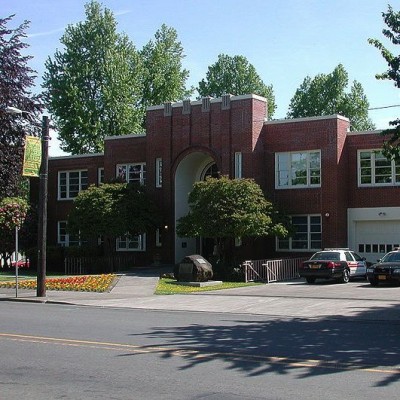
#29 La Grande
Violent Crime Per Capita per 1,000 residents: 2.148
Total Violent Crimes: 28
Population: 13,034
Murder: 0
Sexual Assault: 4
Robbery: 0
Aggravated Assaults: 24
Photo: Roesch Building in La Grande, via Wikimedia Commons
Prev
Next
# 28 Banks
Violent Crime Per Capita per 1,000 residents: 2.148
Total Violent Crimes: 4
Population: 1,862
Murder: 0
Sexual Assault: 0
Robbery: 0
Aggravated Assaults: 4
Interesting fact from the data: Banks only recorded 26 property thefts last year.
Photo: Oregon route 47 in Banks, via Wikimedia Commons
Prev
Next
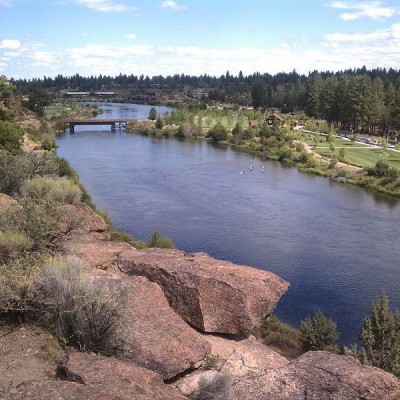
#27 Bend
Violent Crime Per Capita per 1,000 residents: 2.277
Total Violent Crimes: 182
Population: 79,926
Murder: 1
Sexual Assault: 21
Robbery: 22
Aggravated Assaults: 138
Photo: Farewell Bend Park, via Wikimedia Commons
Prev
Next
#26 Mount Angel
Violent Crime Per Capita per 1,000 residents: 2.349
Total Violent Crimes: 8
Population: 3,405
Murder: 0
Sexual Assault: 1
Robbery: 1
Aggravated Assaults: 6
Photo: Mt. Angel, via Wikimedia Commons
Prev
Next
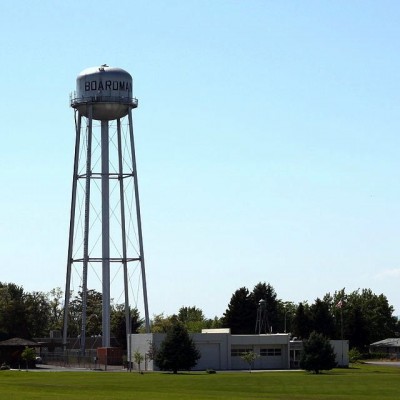
#25 Boardman
Violent Crime Per Capita per 1,000 residents: 2.375
Total Violent Crimes: 8
Population: 3,369
Murder: 0
Sexual Assault: 3
Robbery: 0
Aggravated Assaults: 5
Interesting fact from the data: Boardman only had four motor vehicle thefts last year.
Photo: Boardman Chamber of Commerce and water tower, via Wikimedia Commons
Prev
Next
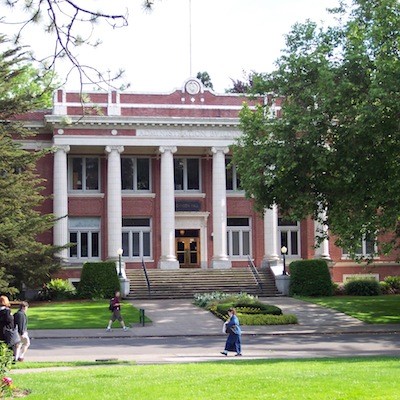
#24 Eugene
Violent Crime Per Capita per 1,000 residents: 2.536
Total Violent Crimes: 402
Population: 158,499
Murder: 0
Sexual Assault: 68
Robbery: 195
Aggravated Assaults: 139
Interesting fact from the data: Eugene had 55 arson cases last year.
Photo: University of Oregon in Eugene
Prev
Next
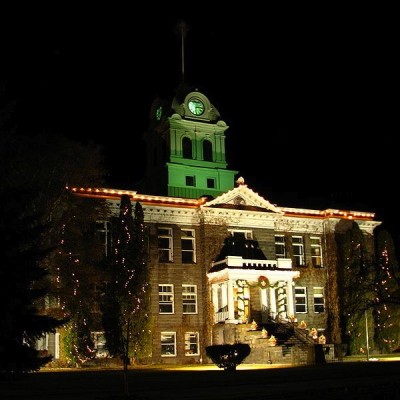
#23 Prineville
Violent Crime Per Capita per 1,000 residents: 2.620
Total Violent Crimes: 24
Population: 9,1661
Murder: 0
Sexual Assault: 1
Robbery: 1
Aggravated Assaults: 22
Photo: Crook County Courthouse in Prineville, via Wikimedia Commons
Prev
Next
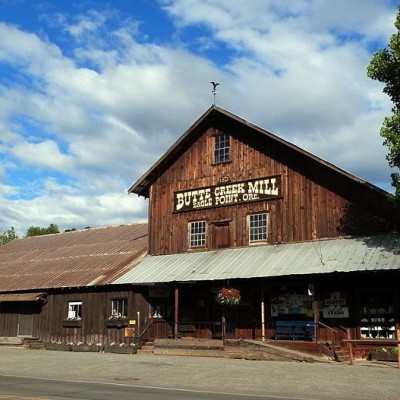
#22 Eagle Point
Violent Crime Per Capita per 1,000 residents: 2.768
Total Violent Crimes: 24
Population: 8,669
Murder: 0
Sexual Assault: 4
Robbery: 8
Aggravated Assaults: 12
Photo: Snowy Butte Flour Mill in Eagle Point, via Wikimedia Commons
Prev
Next
#21 Dallas
Violent Crime Per Capita per 1,000 residents: 2.770
Total Violent Crimes: 41
Population: 14,803
Murder: 0
Sexual Assault: 6
Robbery: 4
Aggravated Assaults: 31
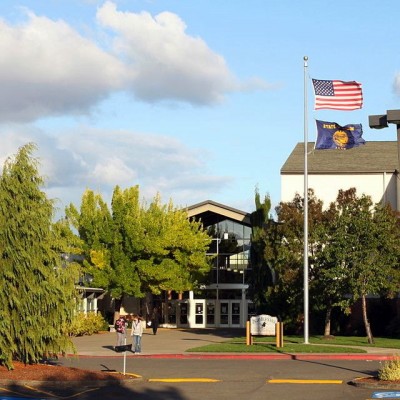
Photo: Dallas High School, via Wikimedia Commons
Prev
Next
#20 Baker City
Violent Crime Per Capita per 1,000 residents: 2.795
Total Violent Crime: 27
Population: 9,600
Murder: 0
Sexual Assault: 1
Robbery: 2
Aggravated Assaults: 24
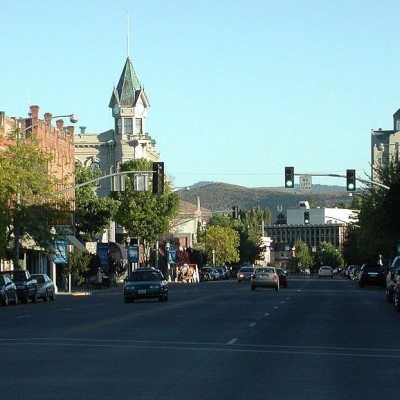
Photo: Main Street in Baker City, via Wikimedia Commons
Prev
Next
#19 Stayton
Violent Crime Per Capita per 1,000 residents: 2.974
Total Violent Crimes: 23
Population: 7,733
Murder: 0
Sexual Assault: 3
Robbery: 5
Aggravated Assaults: 15
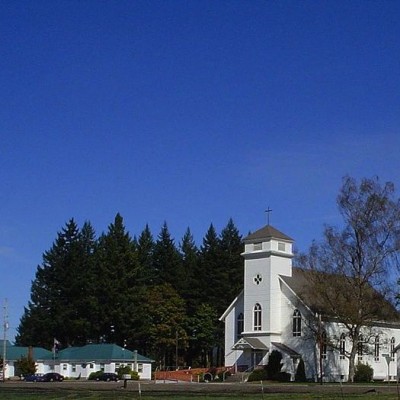
Photo: Lourdes school and church in Stayton, via Wikimedia Commons
Prev
Next
#18 Grants Pass
Violent Crime Per Capita per 1,000 residents: 3.155
Total Violent Crimes: 110
Population: 34,865
Murder: 1
Sexual Assault: 11
Robbery: 35
Aggravated Assaults: 63
Photo: Grants Pass, via Wikimedia Commons
Prev
Next
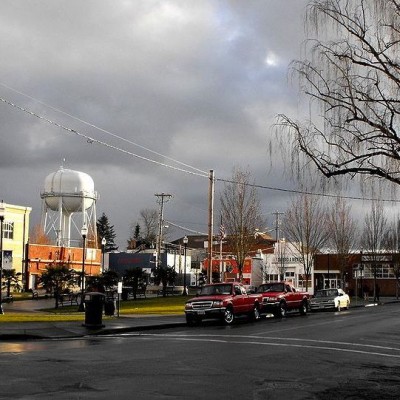
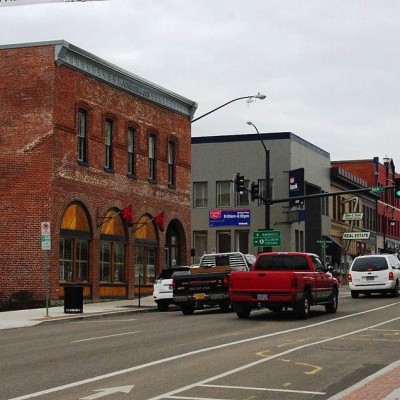
#17 Pendleton
Violent Crime Per Capita per 1,000 residents: 3.195
Total Violent Crime: 54
Population: 16,902
Murder: 0
Sexual Assault: 15
Robbery: 13
Aggravated Assaults: 26
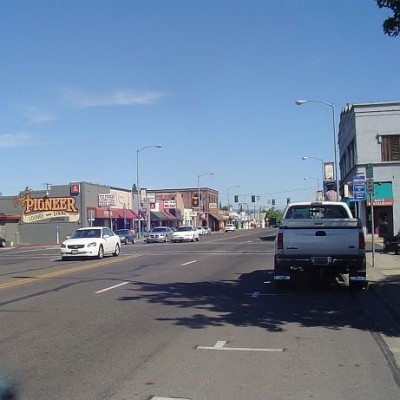
Photo: Main Street in Pendleton, via Wikimedia Commons
Prev
Next
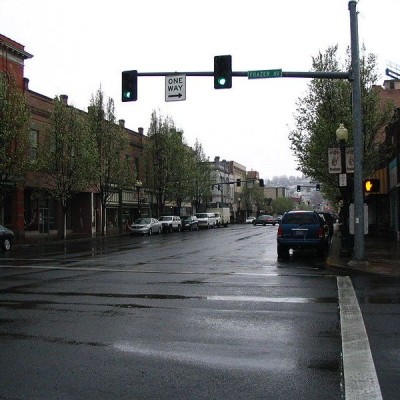
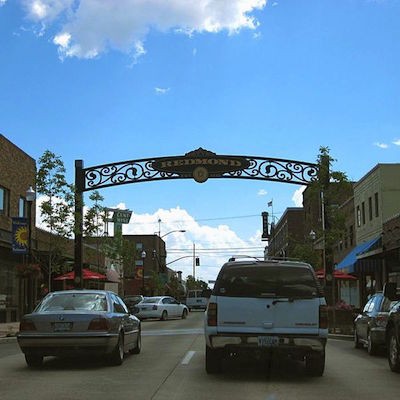
#16 Redmond
Violent Crime Per Capita per 1,000 residents: 3.204
Total Violent Crimes: 87
Population: 27,153
Murder: 0
Sexual Assault: 11
Robbery: 15
Aggravated Assaults: 61
Photo: Highway 97 in Redmond, via Wikimedia Commons

Prev
Next
#15 Salem
Violent Crime Per Capita per 1,000 residents: 3.286
Total Violent Crimes: 520
Population: 158,234
Murder: 7
Sexual Assault: 47
Robbery: 138
Aggravated Assaults: 328
Interesting fact from the data: Salem had 5,143 larceny-thefts last year.
Prev
Next
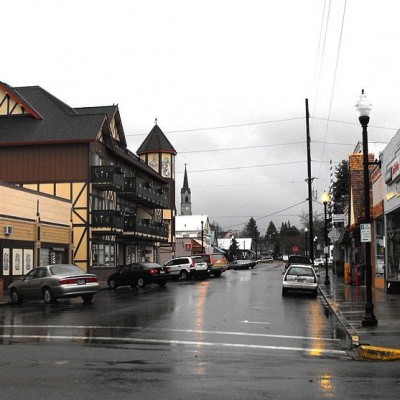
#14 Woodburn
Violent Crime Per Capita per 1,000 residents: 3.380
Total Violent Crimes: 82
Population: 24,263
Murder: 1
Sexual Assault: 7
Robbery: 28
Aggravated Assaults: 46
Photo: Woodburn, via Wikimedia Commons
Prev
Next
#13 Forest Grove
Violent Crime Per Capita per 1,000 residents: 3.417
Total Violent Crimes: 76
Population: 22,239
Murder: 0
Sexual Assault: 12
Robbery: 12
Aggravated Assaults: 52
Photo: Pacific Ave. in downtown Forest Grove, via Wikimedia Commons
Prev
Next
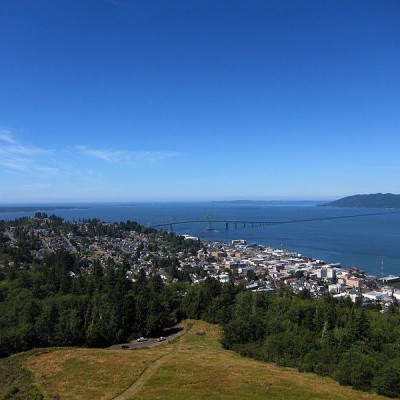
#12 Astoria
Violent Crime Per Capita per 1,000 residents: 3.458
Total Violent Crime: 33
Population: 9,543
Murder: 0
Sexual Assault: 3
Robbery: 1
Aggravated Assaults: 29
Photo: Astoria and the Astoria–Megler Bridge, via Wikimedia Commons

Prev
Next
#11 Klamath Falls
Violent Crime Per Capita per 1,000 residents: 3.612
Total Violent Crime: 76
Population: 21,043
Murder: 2
Sexual Assault: 11
Robbery: 24
Aggravated Assaults: 39
Photo: Upper Klamath Lake Canoe Trail, via Wikimedia Commons

Prev
Next
#10 Coos Bay
Violent Crime Per Capita per 1,000 residents: 3.794
Total Violent Crimes: 60
Population: 15,816
Murder: 1
Sexual Assault: 3
Robbery: 6
Aggravated Assaults: 50
Photo: Cape Arago Overlook in Coos Bay, via Wikimedia Commons
Prev
Next
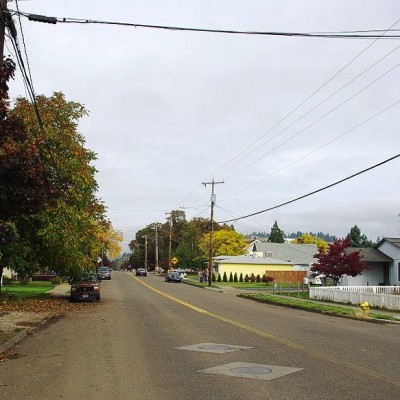
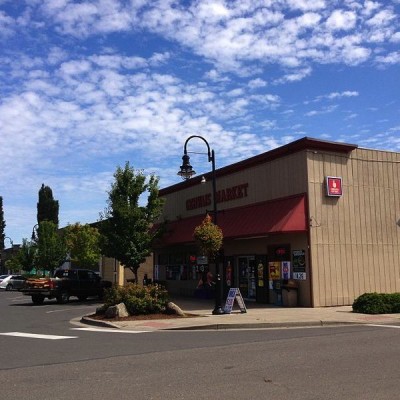
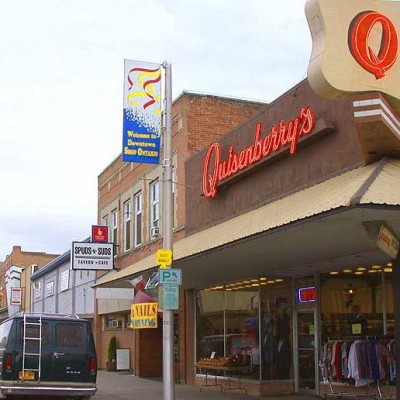
#9 Gervais
Violent Crime Per Capita per 1,000 residents: 3.887
Total Violent Crimes: 10
Population: 2,573
Murder: 0
Sexual Assault: 0
Robbery: 1
Aggravated Assaults: 9
Photo: Fourth Street in downtown Gervais, via Wikimedia Commons
_400_400_90.jpg)
Prev
Next
#8 Lincoln City
Violent Crime Per Capita per 1,000 residents: 4.263
Total Violent Crimes: 34
Population: 7,976
Murder: 0
Sexual Assault: 1
Robbery: 10
Aggravated Assaults: 23
Prev
Next
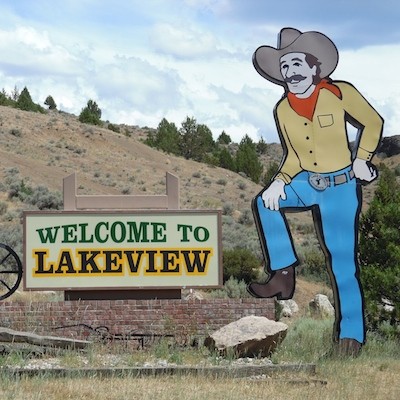
#7 Lakeview
Violent Crime Per Capita per 1,000 residents: 4.440
Total Violent Crimes: 10
Population: 2,252
Murder: 0
Sexual Assault: 1
Robbery: 1
Aggravated Assaults: 8
Prev
Next
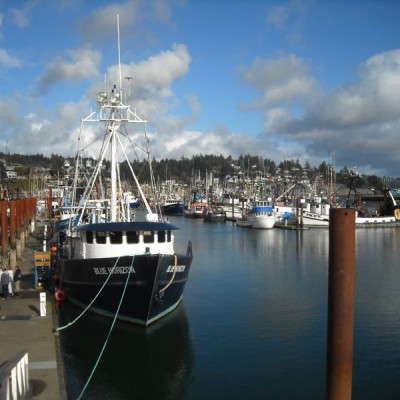
#6 Newport
Violent Crime Per Capita per 1,000 residents: 4.587
Total Violent Crimes: 46
Population: 10,029
Murder: 0
Sexual Assault: 9
Robbery: 3
Aggravated Assaults: 34
Photo: Harbor in Yaquina Bay, Newport, via Wikimedia Commons
Prev
Next
#5 Toledo
Violent Crime Per Capita per 1,000 residents: 4.623
Total Violent Crimes: 16
Population: 3,461
Murder: 1
Sexual Assault: 2
Robbery: 2
Aggravated Assaults: 11
Photo: Toledo city hall, via Wikimedia Commons
Prev
Next
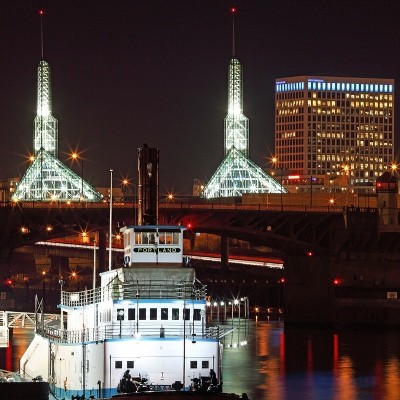
#4 Portland
Violent Crime Per Capita per 1,000 residents: 4.828
Total Violent Crimes: 2,941
Population: 609,136
Murder: 14
Sexual Assault: 234
Robbery: 917
Aggravated Assaults: 1,776

Prev
Next
#3 Gresham
Violent Crime Per Capita per 1,000 residents: 5.556
Total Violent Crimes: 611
Population: 109,965
Murder: 5
Sexual Assault: 52
Robbery: 275
Aggravated Assaults: 279
Photo: Civic Drive Max Station in Gresham, via Wikimedia Commons
Prev
Next
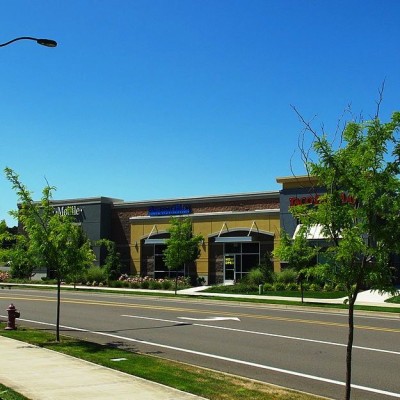
#2 Ontario
Violent Crime Per Capita per 1,000 residents: 5.872
Total Violent Crimes: 65
Population: 11,069
Murder: 1
Sexual Assault: 7
Robbery: 12
Aggravated Assaults: 45
Photo: Downtown Ontario, via Wikimedia Commons
Prev
Next
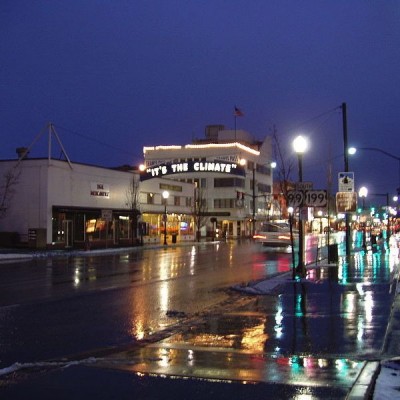
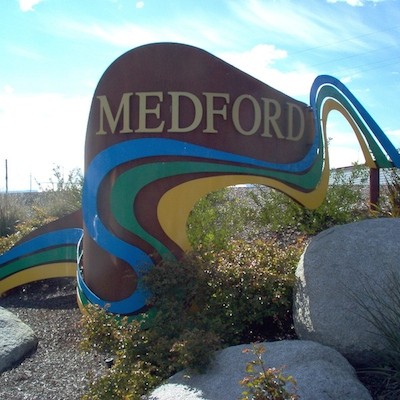
#1 Medford
Violent Crime Per Capita per 1,000 residents: 6.227
Total Violent Crimes: 483
Population: 76,949
Murder: 1
Sexual Assault: 37
Robbery: 99
Aggravated Assaults: 346
Interesting fact from the data: Medford had 4,813 property crimes in 2013, more than Gresham, a city with 30,000 more people in it.
Related Articles
Enjoy this post? Share it with others.
Email to a friend
Permalink


_80_80_90_c1.jpg)


Follow us on Pinterest Google + Facebook Twitter See It Read It