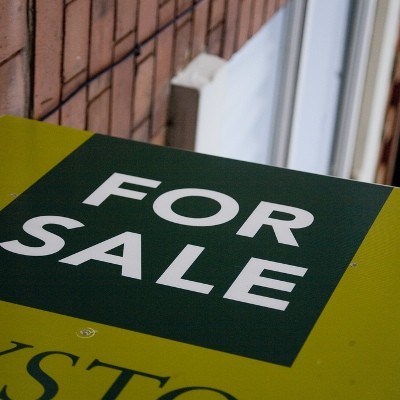
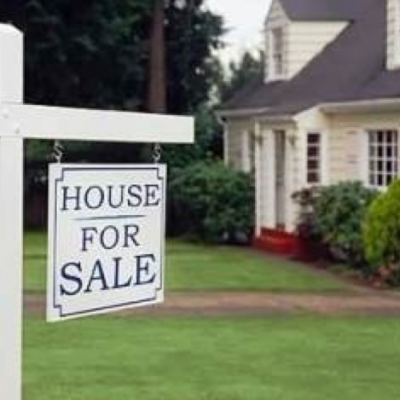
Portland is a Hot House Flipping, but Salem is Much Hotter


 Email to a friend
Permalink
Email to a friend
Permalink
Thursday, March 17, 2016
GoLocalPDX Business Team
Portland's housing market is hot -- up more than 14% year over year, but Salem's house flipping is close to leading the country. In the Western portion of the U.S., Salem's 28% year-over-year increase in average housing price is second only to Salt Lake City's 32% increase.
A home flip is defined as "a property that is sold in an arms-length sale for the second time within a 12-month period based on publicly recorded sales deed data collected by RealtyTrac in more than 950 counties accounting for more than 80 percent of the U.S. population," according to RealtyTrac.
“As confidence in the housing recovery spreads, more real estate investors and would-be real estate investors are hopping on the home flipping bandwagon,” said Daren Blomquist, Senior Vice President at RealtyTrac. “Not only is the share of home flips on the rise again, but we also see the flipping trend trickling down to smaller investors who are completing fewer flips per year. The total number of investors who completed at least one flip in 2015 was at the highest level since 2007, and the number of flips per investor was at the lowest level since 2008.”
Salem v Portland
Salem homes may be getting flipped at a much higher rate than Portland homes, but the average home price is a significantly lower in Salem. The median home price of a property flipped in Salem is $130,000 and in the Portland metro area it is $199,000.
There were 110,008 investors or businesses entities that completed at least one home flip in 2015, the highest number of home flippers since 2007, when there were 130,603 home flippers -- just before the collapse of the housing market.
“More inexperienced home flippers with a smaller financial cushion could be a sign of an over-speculative market, but the data indicates that flippers in 2015 continued to operate within relatively conservative margins,” Blomquist said. “Homes flipped in 2015 were on average purchased at a 26 percent discount below estimated market value and re-sold by the flipper at a 5 percent premium above estimated market value.”
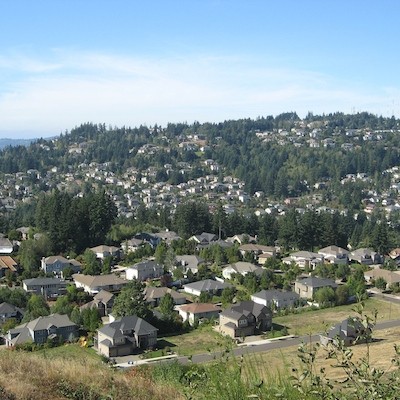
Related Slideshow: Portland’s 20 Hottest Neighborhoods for Real Estate
What are Portland’s hottest neighborhoods for real estate? The 20 neighborhoods below are ranked by the number of sold homes over the last 90 days. The information, along with the median list price and median price per square foot, comes from the real estate company Redfin. The population is from 2010 census data.
The sale to list percentage, also from Redfin, is the final selling price over what the listed price was, to show how close sellers came to their asking price. In cases where it is over 100 percent, the seller got more than then listed price.
Find out what the hottest real estate neighborhoods in Portland are:
Prev
Next
#20 (tied)
# of Homes Sold Over the Last 90 Days: 34
Median List Price: $259,925
Median Price Per Square Foot: $143
Sale to List Percentage: 98.1%
Population: 8,775
Note: Sale to List Percentage shows how close the sale price was to the listed price.

Prev
Next
#19 (tied)
# of Homes Sold Over the Last 90 Days: 34
Median List Price: $489,700
Median Price Per Square Foot: $287
Sale to List Percentage: 98.3%
Population: 8,982
Note: Sale to List Percentage shows how close the sale price was to the listed price.

Prev
Next
#18 (tied)
# of Homes Sold Over the Last 90 Days: 34
Median List Price: $497,000
Median Price Per Square Foot: $345
Sale to List Percentage: 98.9%
Population: 11,607
Note: Sale to List Percentage shows how close the sale price was to the listed price.
Prev
Next
#17
# of Homes Sold Over the Last 90 Days: 36
Median List Price: $394,500
Median Price Per Square Foot: $442
Sale to List Percentage: 97.5%
Population: 12,801
Note: Sale to List Percentage shows how close the sale price was to the listed price.
Prev
Next
#16 (tied)
# of Homes Sold Over the Last 90 Days: 38
Median List Price: $574,900
Median Price Per Square Foot: $356
Sale to List Percentage: 99.2%
Population: 10,162
Note: Sale to List Percentage shows how close the sale price was to the listed price.

Prev
Next
#15 (tied)
# of Homes Sold Over the Last 90 Days: 38
Median List Price: $235,000
Median Price Per Square Foot: $180
Sale to List Percentage: 100.3%
Population: 13,209
Note: Sale to List Percentage shows how close the sale price was to the listed price.
Prev
Next
#14 (tied)
# of Homes Sold Over the Last 90 Days: 39
Median List Price: $249,974
Median Price Per Square Foot: $178
Sale to List Percentage: 98.7%
Population: 7,397
Note: Sale to List Percentage shows how close the sale price was to the listed price.
_400_400_90.jpg)
Prev
Next
#13 (tied)
# of Homes Sold Over the Last 90 Days: 39
Median List Price: $249,974
Median Price Per Square Foot: $178
Sale to List Percentage: 98.7%
Population: 9,550
Note: Sale to List Percentage shows how close the sale price was to the listed price.

Prev
Next
#12 (tied)
# of Homes Sold Over the Last 90 Days: 42
Median List Price: $234,925
Median Price Per Square Foot: $164
Sale to List Percentage: 97.6%
Population: 12,207
Note: Sale to List Percentage shows how close the sale price was to the listed price.
Prev
Next
#11 (tied)
# of Homes Sold Over the Last 90 Days: 42
Median List Price: $574,950
Median Price Per Square Foot: $361
Sale to List Percentage: 98.2%
Population: 7,088
Note: Sale to List Percentage shows how close the sale price was to the listed price.

Prev
Next
#10
# of Homes Sold Over the Last 90 Days: 43
Median List Price: $225,000
Median Price Per Square Foot: $172
Sale to List Percentage: 101.1%
Population: 9,789
Note: Sale to List Percentage shows how close the sale price was to the listed price.
Prev
Next
#9
# of Homes Sold Over the Last 90 Days: 44
Median List Price: $274,700
Median Price Per Square Foot: $185
Sale to List Percentage: 97.8%
Population (Mount Scott-Arleta): 7,397
Note: Sale to List Percentage shows how close the sale price was to the listed price.
Prev
Next
#8
# of Homes Sold Over the Last 90 Days: 50
Median List Price: $203,000
Median Price Per Square Foot: $153
Sale to List Percentage: 99.6%
Population: 23,662
Note: Sale to List Percentage shows how close the sale price was to the listed price.
Prev
Next
#7
# of Homes Sold Over the Last 90 Days: 51
Median List Price: $500,000
Median Price Per Square Foot: $445
Sale to List Percentage: 98.9%
Population: 5,997
Note: Sale to List Percentage shows how close the sale price was to the listed price.
Prev
Next
#6
# of Homes Sold Over the Last 90 Days: 54
Median List Price: $699,900
Median Price Per Square Foot: $253
Sale to List Percentage: 101.3%
Population: 5,346
Note: Sale to List Percentage shows how close the sale price was to the listed price.
Prev
Next
#5
# of Homes Sold Over the Last 90 Days: 56
Median List Price: $225,000
Median Price Per Square Foot: $166
Sale to List Percentage: 98.3%
Population: 23,462
Note: Sale to List Percentage shows how close the sale price was to the listed price.
Prev
Next
#4
# of Homes Sold Over the Last 90 Days: 58
Median List Price: $184,950
Median Price Per Square Foot: $161
Sale to List Percentage: 99.3%
Population (Brentwood-Darlington): 12,994
Note: Sale to List Percentage shows how close the sale price was to the listed price.

Prev
Next
#3
# of Homes Sold Over the Last 90 Days: 67
Median List Price: $214,950
Median Price Per Square Foot: $164
Sale to List Percentage: 97.9%
Population: 30,639
Note: Sale to List Percentage shows how close the sale price was to the listed price.
Prev
Next
#2
# of Homes Sold Over the Last 90 Days: 67
Median List Price: $222,500
Median Price Per Square Foot: $201
Sale to List Percentage: 100%
Population: 16,287
Note: Sale to List Percentage shows how close the sale price was to the listed price.
Prev
Next
#1
# of Homes Sold Over the Last 90 Days: 81
Median List Price: $212,450
Median Price Per Square Foot: $178
Sale to List Percentage: 99.3%
Population: 12,994
Note: Sale to List Percentage shows how close the sale price was to the listed price.
Related Articles
Enjoy this post? Share it with others.
Email to a friend
Permalink


_80_80_90_c1.jpg)


Follow us on Pinterest Google + Facebook Twitter See It Read It