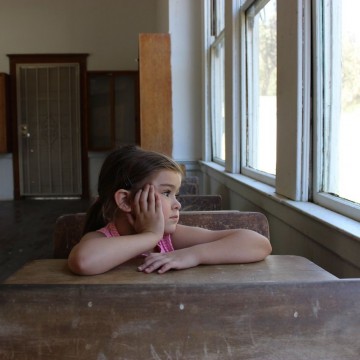
Two 1sts for Kindergarteners: Standardized Test & the 1st Day of School


Tuesday, August 11, 2015
“The test itself is not reliable and valid, and it’s an inappropriate test to be giving to kindergarteners,” said Dana Brenner-Kelley, a member of Oregon SOS and a North Portland resident.
Brenner-Kelley is organizing three events this month—Aug. 20, 21 and 23—to make parents aware of the tests and tell them how to opt out. All of the events will have kindergarten teachers available to add perspective. Two of the events will also screen “Education, Inc.”
Two Tests
The Oregon Kindergarten Assessment is different from the Smarter Balanced tests that have received heated debate and perhaps more attention.
For starters, the kindergarten assessment is given at the beginning of the year instead of at the end of the year. And it’s not tied to teacher evaluation, which the Smarter Balanced tests are. “They’re really quite different, which is why it hasn’t been one of the policies we’ve worked on,” said Stand for Children spokesman Kelsey Cardwell.
Stand for Children has been supportive of the Common Core standards and the correlating Smarter Balanced tests.
Ultimately, to Brenner-Kelley, the problem for both tests stems from an increased corporatization of education. The Oregon Education Investment Board, started by former Gov. John Kitzhaber, was “made up of business leaders with corporate interests in guiding education.” Though the board was disbanded by Gov. Kate Brown, the legacy lives on.
“It’s high stakes from a systemic point of view,” Brenner-Kelley said. For her the question is: “How is this data going to be used in a way that affects this child in inappropriate ways?”
While the test results are showing lower scores for low-income students, which could drive more funding toward low-income schools, Brenner-Kelley said that “drilling” academics into children at a younger age will “create much worse performance for these kids.”
The testing is “high stakes” in the sense that it places pressure on programs that are publicly funded to implement more rigorous academics at an earlier age in order to maintain funding.
A former Washington state Head Start Association director, she said what kids need at an early age is play-based learning. “They’re trying to push the Common Core and academics further down into early education,” she said.

While higher income schools have better performing students, the students in Lake Oswego have access to a lot more early education programming, said Brenner-Kelley. “If what (students) are getting is testing instead of play based learning, they’re not going to be getting the same thing as kids in Lake Oswego.”
She worries that the academic approach creates disinterest in school from a young age.
Additionally, the data from the tests is being wrongly interpreted, she said. For example, last year, the Oregonian ran an article on how kindergarteners were not prepared for school using the data from the Oregon Kindergarten Assessment.
This kind of information “manipulates communities,” said Brenner-Kelley. “The state is using inappropriate data points to drill academics… That is going to create much worse performance for these kids.”
The test does not measure kindergarten readiness, said Brenner-Kelley. It is actually a composite of other standardized tests meant to be given at the end of the year to measure whether a child understood a teacher’s instruction.
“It seems pretty ridiculous that the first thing that kids are experiencing is a test that has not been designed to measure what they would know entering kindergarten,” said Brenner-Kelley.
Additionally, the test has not been validated by studies to show whether it is actually measuring what it intends to measure, she said. But since it’s meant to measure teacher performance, it’s the wrong test given at the wrong time.
Brenner-Kelley also pointed out that kids have varying levels of anxiety and processing speed in kindergarten. “Some are conscious they’re being given an assessment, some are not,” she said.

Using this test in kindergarten is particularly problematic because younger children have more variable learning rates. “It’s very normal for children to develop at different speeds,” she said. “Whether a child reads at four, six or seven doesn’t have any impact on outcomes later on.”
And the test may not actually capture what each student knows. The test is scripted, and teachers can’t add anything to what they’re saying. It is also timed. “Many kids will do very poorly that actually know the things that they’re being tested on,” said Brenner-Kelley.
There’s also a portion on behavior that is completed by the teacher using their observations, but, of course, that means it’s pretty subjective.
“The test was not designed to draw conclusions the way the state is trying to,” said Brenner-Kelley.
In that way it is “high stakes” just like the Smarter Balanced tests.
In June, Governor Kate Brown signed House Bill 2655 permitting parents to opt their children out of taking the Smarter Balanced tests. But since the bill refers to the Smarter Balanced tests, there has been confusion over whether parents can opt out of the kindergarten assessment.
“The state is trying to intimidate parents into thinking that we don’t have a right, but we do,” said Brenner-Kelley, who based her reasoning on the 14th amendment, which refers to citizenship and civil rights. “Parents have the right to opt out for any reason… The state has illegal laws that aren’t supported by the constitution. This is just a lawsuit waiting to happen.”
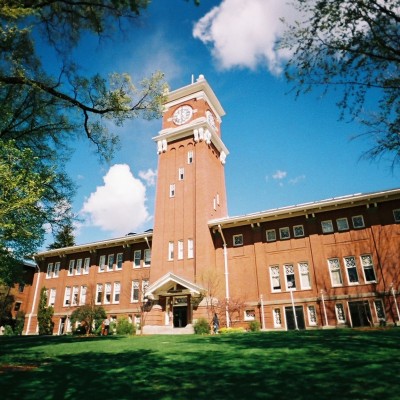
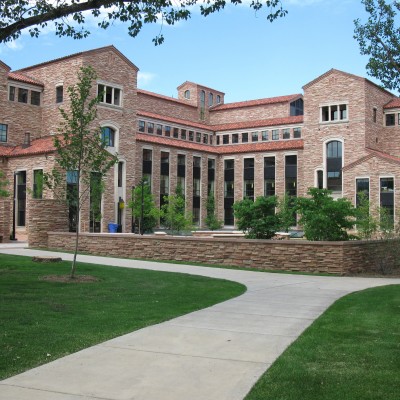
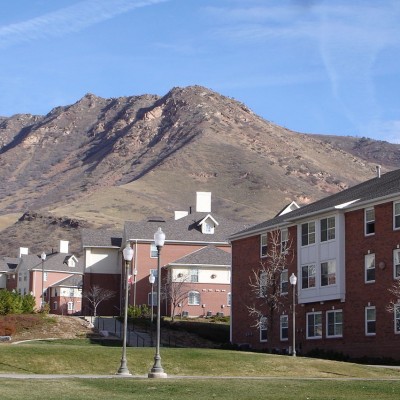
Related Slideshow: Ranking of Student Diversity in Pac-12 Schools
Rates of diversity among Pac-12 schools run the gamut between holding a hefty majority to scraping by with a slim minority. UCLA had a whopping 69.8%, compared to the University of Oregon's 20.9%. In fact, Univerity of Oregon ranked as the least diverse among the 12 schools in the conference. Using demographic data for the 2013-2014 school year provided by each university, GoLocalPDX sorted the schools by their rates of diversity within their student bodies. *University of Utah latest available data was from 2012-2013.
_-_5_400_400_90.jpg)


_-_5_80_80_90_c1.jpg)


Related Articles
- Why I Love My Diverse and Accepting School
- Why I Teach: A Portland-Area High School Teacher Reflects
- See Oregon’s Top 100 High Schools
- The Luxe List: Back-to-School Gear Worth Getting
- Oregon Elementary School Teachers Paid Far Less Than California Teachers


Follow us on Pinterest Google + Facebook Twitter See It Read It