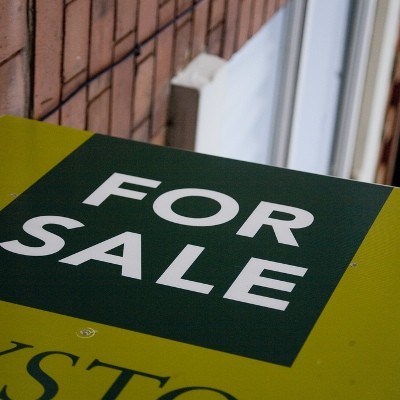
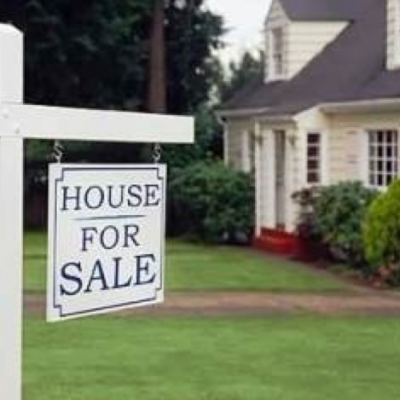
Portland City Officials Earmark $66.7 Million for Affordable Housing


 Email to a friend
Permalink
Email to a friend
Permalink
Friday, October 23, 2015
Mayor Charlie Hales announced today that $66.7 million in funds will be directed to affordable housing projects in five Urban Renewal Districts over the next 5 years.
“We have great projects in various stages of planning, in each district,” Hales said. “But we are in a housing crisis. Given that, we have scrubbed each URA in detail, looking at both opportunities and costs, in an effort to direct money toward affordable housing while maintaining projects to enhance jobs, livability and equity.”
The new money was added to a pot of $202.3 million already in place in those districts. The new money comes from an increase in tax funding being directed towards affordable housing.
The Urban Renewal Districts affected are: Gateway, Interstate, Lents, North Macadam and the River District.
Two action plans already in place, The Old Town/China Town Five Year Action Plan within the River District, and the Lents Action Plan, will remain intact.
“To seriously address the affordability crisis, we have to look at all potential sources of funding,” Commissioner Dan Saltzman said. “Increasing the amount of money we spend in urban renewal areas for housing is a community-led solution which I am pleased to join the Mayor and Commissioner Fish to support.”
The Council will have a hearing on the proposed changes at the Oct. 28 City Council meeting, with a vote expected the following week.
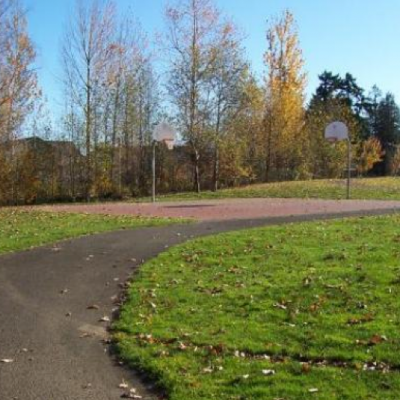
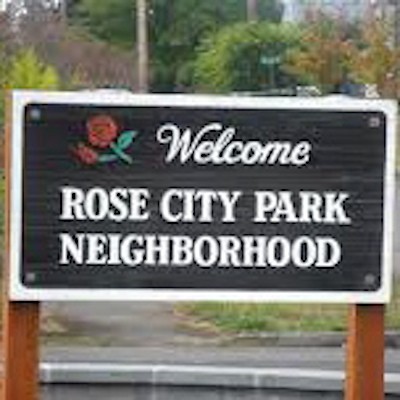
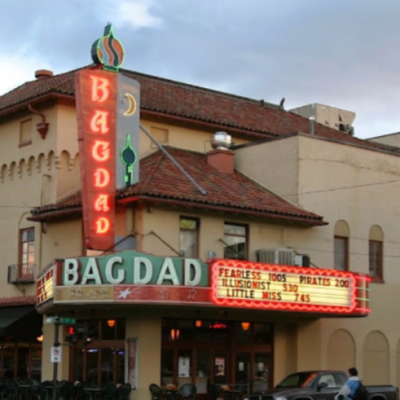
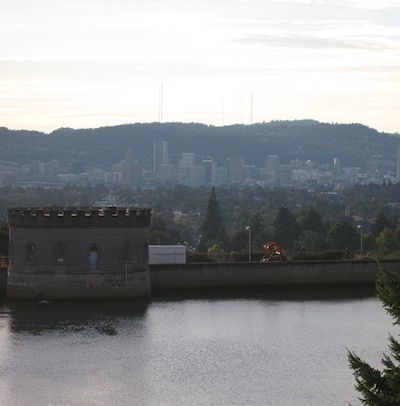
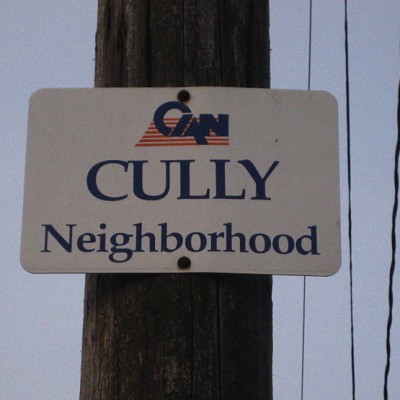
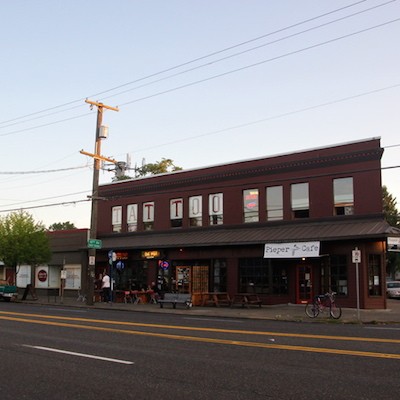
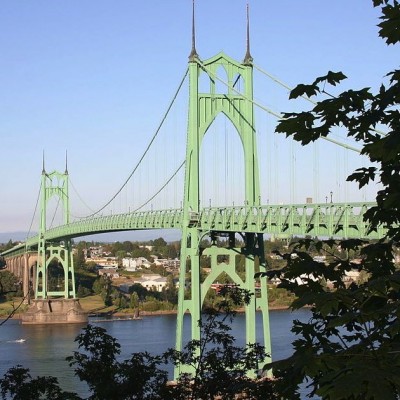
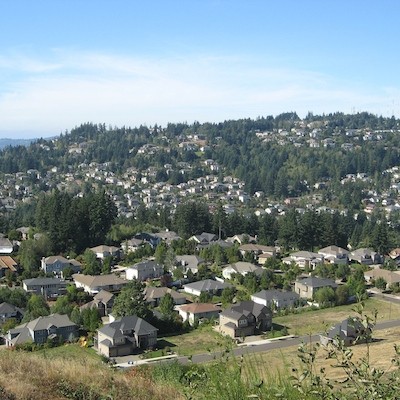
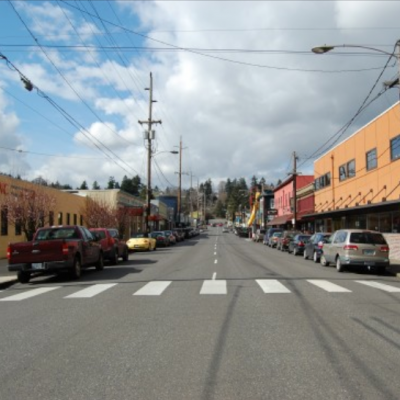
Related Slideshow: Portland’s 20 Hottest Neighborhoods for Real Estate
What are Portland’s hottest neighborhoods for real estate? The 20 neighborhoods below are ranked by the number of sold homes over the last 90 days. The information, along with the median list price and median price per square foot, comes from the real estate company Redfin. The population is from 2010 census data.
The sale to list percentage, also from Redfin, is the final selling price over what the listed price was, to show how close sellers came to their asking price. In cases where it is over 100 percent, the seller got more than then listed price.
Find out what the hottest real estate neighborhoods in Portland are:
Prev
Next
#20 (tied)
# of Homes Sold Over the Last 90 Days: 34
Median List Price: $259,925
Median Price Per Square Foot: $143
Sale to List Percentage: 98.1%
Population: 8,775
Note: Sale to List Percentage shows how close the sale price was to the listed price.
Prev
Next
#19 (tied)
# of Homes Sold Over the Last 90 Days: 34
Median List Price: $489,700
Median Price Per Square Foot: $287
Sale to List Percentage: 98.3%
Population: 8,982
Note: Sale to List Percentage shows how close the sale price was to the listed price.
Prev
Next
#18 (tied)
# of Homes Sold Over the Last 90 Days: 34
Median List Price: $497,000
Median Price Per Square Foot: $345
Sale to List Percentage: 98.9%
Population: 11,607
Note: Sale to List Percentage shows how close the sale price was to the listed price.
Prev
Next
#17
# of Homes Sold Over the Last 90 Days: 36
Median List Price: $394,500
Median Price Per Square Foot: $442
Sale to List Percentage: 97.5%
Population: 12,801
Note: Sale to List Percentage shows how close the sale price was to the listed price.
Prev
Next
#16 (tied)
# of Homes Sold Over the Last 90 Days: 38
Median List Price: $574,900
Median Price Per Square Foot: $356
Sale to List Percentage: 99.2%
Population: 10,162
Note: Sale to List Percentage shows how close the sale price was to the listed price.
Prev
Next
#15 (tied)
# of Homes Sold Over the Last 90 Days: 38
Median List Price: $235,000
Median Price Per Square Foot: $180
Sale to List Percentage: 100.3%
Population: 13,209
Note: Sale to List Percentage shows how close the sale price was to the listed price.
Prev
Next
#14 (tied)
# of Homes Sold Over the Last 90 Days: 39
Median List Price: $249,974
Median Price Per Square Foot: $178
Sale to List Percentage: 98.7%
Population: 7,397
Note: Sale to List Percentage shows how close the sale price was to the listed price.
_400_400_90.jpg)
Prev
Next
#13 (tied)
# of Homes Sold Over the Last 90 Days: 39
Median List Price: $249,974
Median Price Per Square Foot: $178
Sale to List Percentage: 98.7%
Population: 9,550
Note: Sale to List Percentage shows how close the sale price was to the listed price.
Prev
Next
#12 (tied)
# of Homes Sold Over the Last 90 Days: 42
Median List Price: $234,925
Median Price Per Square Foot: $164
Sale to List Percentage: 97.6%
Population: 12,207
Note: Sale to List Percentage shows how close the sale price was to the listed price.
Prev
Next
#11 (tied)
# of Homes Sold Over the Last 90 Days: 42
Median List Price: $574,950
Median Price Per Square Foot: $361
Sale to List Percentage: 98.2%
Population: 7,088
Note: Sale to List Percentage shows how close the sale price was to the listed price.

Prev
Next
#10
# of Homes Sold Over the Last 90 Days: 43
Median List Price: $225,000
Median Price Per Square Foot: $172
Sale to List Percentage: 101.1%
Population: 9,789
Note: Sale to List Percentage shows how close the sale price was to the listed price.
Prev
Next
#9
# of Homes Sold Over the Last 90 Days: 44
Median List Price: $274,700
Median Price Per Square Foot: $185
Sale to List Percentage: 97.8%
Population (Mount Scott-Arleta): 7,397
Note: Sale to List Percentage shows how close the sale price was to the listed price.
Prev
Next
#8
# of Homes Sold Over the Last 90 Days: 50
Median List Price: $203,000
Median Price Per Square Foot: $153
Sale to List Percentage: 99.6%
Population: 23,662
Note: Sale to List Percentage shows how close the sale price was to the listed price.
Prev
Next
#7
# of Homes Sold Over the Last 90 Days: 51
Median List Price: $500,000
Median Price Per Square Foot: $445
Sale to List Percentage: 98.9%
Population: 5,997
Note: Sale to List Percentage shows how close the sale price was to the listed price.
Prev
Next
#6
# of Homes Sold Over the Last 90 Days: 54
Median List Price: $699,900
Median Price Per Square Foot: $253
Sale to List Percentage: 101.3%
Population: 5,346
Note: Sale to List Percentage shows how close the sale price was to the listed price.
Prev
Next
#5
# of Homes Sold Over the Last 90 Days: 56
Median List Price: $225,000
Median Price Per Square Foot: $166
Sale to List Percentage: 98.3%
Population: 23,462
Note: Sale to List Percentage shows how close the sale price was to the listed price.
Prev
Next
#4
# of Homes Sold Over the Last 90 Days: 58
Median List Price: $184,950
Median Price Per Square Foot: $161
Sale to List Percentage: 99.3%
Population (Brentwood-Darlington): 12,994
Note: Sale to List Percentage shows how close the sale price was to the listed price.
Prev
Next
#3
# of Homes Sold Over the Last 90 Days: 67
Median List Price: $214,950
Median Price Per Square Foot: $164
Sale to List Percentage: 97.9%
Population: 30,639
Note: Sale to List Percentage shows how close the sale price was to the listed price.
Prev
Next
#2
# of Homes Sold Over the Last 90 Days: 67
Median List Price: $222,500
Median Price Per Square Foot: $201
Sale to List Percentage: 100%
Population: 16,287
Note: Sale to List Percentage shows how close the sale price was to the listed price.
Prev
Next
#1
# of Homes Sold Over the Last 90 Days: 81
Median List Price: $212,450
Median Price Per Square Foot: $178
Sale to List Percentage: 99.3%
Population: 12,994
Note: Sale to List Percentage shows how close the sale price was to the listed price.
Related Articles
Enjoy this post? Share it with others.
Email to a friend
Permalink


_80_80_90_c1.jpg)


Follow us on Pinterest Google + Facebook Twitter See It Read It