Oregon Virtual Public Schools Offer Options, But Numbers Show a Lack in Quality


 Email to a friend
Permalink
Email to a friend
Permalink
Wednesday, March 04, 2015
Melanie Sevcenko, GoLocalPDX Contributor
High school English teacher Tim Keene sees the importance of giving each of his students the attention they need. It’s not an easy job, with 150 students in his 10th grade class. Keene lives in Portland and is employed by Oregon Connections Academy, a virtual public charter school that employs 126 teachers and enrolls 3,900 students across the state.
Oregon Connections Academy is the largest of 13 virtual public charter schools in the state. That number, however, does not include online education programs launched by school districts, like the Tigard Tualatin Online Academy.
Across the nation, the online public school is the fastest growing sector in K –12 education. According to a 2014 report by The University of Colorado Boulder's National Education Policy Center (NEPC), there are 400 full-time virtual schools operating in the U.S., enrolling 260,000 students. This is around a 22 percent increase in enrollment from 2011.
Tim Keene says students at his school are allowed to work at their own pace, which makes room for other activities – a karate lesson, horseback riding, or even a walk around the neighborhood. Oregon Connections Academy also offers in-person clubs and field trips.
“This gives them the best of both worlds,” said Keene. “I have students that work full-time, they have 9 to 5 jobs, so they do their school in the evening, and that works for them. It’s all about the flexibility.”
Unlike the bricks-and-mortar model, where a teacher is “presenting” in front of a classroom, Keene says he has more time to work individually with each student on the curriculum and concepts. Sometimes that means email follow up, other times it’s a phone call directly to the student or the parents. And like his students, Keene works from home.
Every week he provides a “live lesson” through a microphone on his computer, and then presents the curriculum using a PowerPoint presentation. Both teacher and students use the same collaborative software that includes online textbooks and a host of different drop-down menus and tools. Students can jump on their own microphone to ask a question, start a chat, and even “raise their hand” using the appropriate icon.
More Options
Online learning offers flexibility, credit recovery, custom-fit curriculum, and the newest in multimedia technologies. But there are other reasons why students have opted for online education: maybe they’re bullied, have severe allergies, live in rural areas with limited choices, or have parents that feel their schools that are no longer safe.
What proponents of virtual education want is another option outside of the traditional public education system, especially in the face of cutbacks. For the 2014 – 2015 school year, the state of Oregon gave approximately $3.4 billion to school districts – that’s less than most states. The vast majority of that went to bricks-and-mortar schools in Oregon, and not to virtual education.
Oregon K – 12 grades are also suffering. The 2015 annual “Quality Counts” report, issued by the newspaper Education Week, ranked Oregon 41st out of 50 states, giving it a grade of C-minus. That’s below the national average grade of C. The state’s graduation rates are also low at 72 percent, which is up from 68.7 percent in 2013, according to the Oregon Department of Education, when Oregon was near the national bottom.
Public for Profit
Most full-time virtual schools in Oregon, and across the nation, are organized as public charter schools that are sponsored by a school district. Many of them, like Oregon Connections Academy, contract with for-profit companies that supply them with curriculum, virtual platforms, teachers, and online services. They are funded just like any other public school in the state – by taxpayer dollars – but they’re governed by their own boards.
The two biggest for-profit companies for online schooling in the United States are K12 Inc. and Connections Academy. K12 Inc. provides online curriculum and services to over 2,000 public school districts and manages 70 virtual schools. It also contracts with 15 virtual schools in Oregon.
The fact that taxpayer dollars for education end up in the pockets of for-profit corporations has caused some educators and scholars to raise suspicion.
The Oregon Education Association (OEA), a teachers union, states on its website: “The virtual vendors running many of Oregon’s online schools refuse to disclose how much money they make from the tax dollars that flow to their operations, but research in other states has shown as much as 40 percent goes to profit.”
Quality is also a concern. The NEPC reports that more than two-thirds of the nation’s virtual schools have unsatisfactory performance ratings. And the graduation rate for students at full-time virtual schools was only 43.8 percent. That’s a little more than half the national average.
In Oregon, too, performance ratings of virtual public charter schools are below the state average, according to data provided by the Oregon Department of Education. The state requires that a student check-in with their teacher, via email or phone, only twice per week to meet state attendance requirements. Deadlines, too, are not enforced for schoolwork. For some, this is worrisome.
“There’s a lot of learning that takes place during the average school day and many essential skills simply can't be taught virtually,” said OEA President Hanna Vaandering, who is concerned that Oregon bricks-and-mortar education is facing cutbacks. “As a teacher, I can tell you that nothing replaces face-to-face contact. So, when we consider the very real needs of the vast majority of Oregon students, we’re always going to be on the side of putting already scant resources into traditional public school classrooms. Technology needs to enrich learning, not usurp it.”
The Blended Approach
The solution to improve quality might be a blended approach, combining both online curriculum and bricks-and-mortar instruction. The Oregon Department of Education reports that several school districts across the state are launching online programs, within bricks-and-mortar public schools, to increase learning opportunities for students.
Alex Molar, Publications Director at the NEPC, is an advocate of the blended method. “The available evidence on blended instruction suggests that contact with a flesh and blood teacher in the presence of other students, and engaging with the material that is also available online is probably the most powerful approach,” said Molnar.
Related Slideshow: Top 100 Oregon High Schools
GoLocalPDX has ranked high schools across the state based on a method developed at Babson College, Mass. See below for the top 100 schools in the Beaver State.

Prev
Next
#100
South Albany High School
Greater Albany Public School District
Enrollment: 1260
Economically disadvantaged: 55%
Met or exceeded reading standards: 86.9%
Met or exceeded math standards: 65.5%
Met or exceeded writing standards: 68.1%
Met or exceeded science standards: 54.6%
Four year graduation rate: 76.2%
Photo Credit: kamera kızı via Compfight cc

Prev
Next
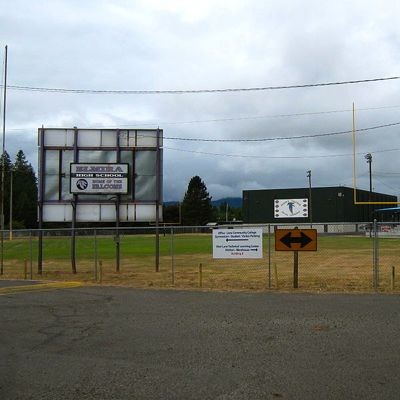
#99
Yamhill Carlton High
Yamhill Carlton School District
Enrollment: 375
Economically disadvantaged: 32%
Met or exceeded reading standards: 93.8%
Met or exceeded math standards: 60.8%
Met or exceeded writing standards: 47.9%
Met or exceeded science standards: 69.6%
Four year graduation rate: 83.8%

Prev
Next
#98
Phoenix High
Phoenix-Talent School District
Enrollment: 695
Economically disadvantaged: 54%
Met or exceeded reading standards: 88.3%
Met or exceeded math standards: 74.7%
Met or exceeded writing standards: 64%
Met or exceeded science standards: 56.4%
Four year graduation rate: 70.6%
Prev
Next
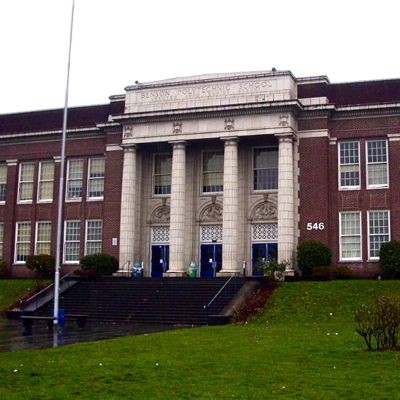
#97
Benson Polytechnic High
Portland School District
Enrollment: 819
Economically disadvantaged: 68%
Met or exceeded reading standards: 87.1%
Met or exceeded math standards: 75.9%
Met or exceeded writing standards: 40.8%
Met or exceeded science standards: 84%
Four year graduation rate: 82.2%
Prev
Next
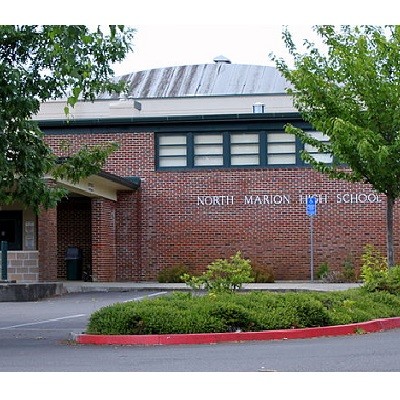
#96
North Marion High
North Marion School District
Enrollment: 588
Economically disadvantaged: 62%
Met or exceeded reading standards: 86.3%
Met or exceeded math standards: 64.9%
Met or exceeded writing standards: 58.6%
Met or exceeded science standards: 58.5%
Four year graduation rate: 87.6%

Prev
Next
#95
Hidden Valley High
Three Rivers/Josephine County School District
Enrollment: 681
Economically disadvantaged: 53%
Met or exceeded reading standards: 83.7%
Met or exceeded math standards: 71.4%
Met or exceeded writing standards: 52.2%
Met or exceeded science standards: 66.7%
Four year graduation rate: 68.3%
Photo Credit: dcJohn via Compfight cc
Photo Credit: sleepyneko via Compfight cc

Prev
Next
#94
North Valley High
Three Rivers/Josephine County School District
Enrollment: 522
Economically disadvantaged: 51%
Met or exceeded reading standards: 89.2
Met or exceeded math standards: 56%
Met or exceeded writing standards: 46.8%
Met or exceeded science standards: 72.2%
Four year graduation rate: 68.3%
Photo Credit: naosuke ii via Compfight cc
Photo Credit: peteoshea via Compfight cc

Prev
Next
#93
Stayton High
North Santiam School District
Enrollment: 749
Economically disadvantaged: 48%
Met or exceeded reading standards: 85.3%
Met or exceeded math standards: 68.9%
Met or exceeded writing standards: 56.8%
Met or exceeded science standards: 70.6%
Four year graduation rate: 70.1%
Photo Credit: katerha via Compfight cc
Prev
Next
#92
Liberty High
Hillsboro School District
Enrollment: 1386
Economically disadvantaged: 46%
Met or exceeded reading standards: 89.8%
Met or exceeded math standards: 76%
Met or exceeded writing standards: 53.3%
Met or exceeded science standards: 65.8%
Four year graduation rate: 79.6%
Photo Credit: Aboutmovies, CC

Prev
Next
#91
Academy of Arts and Academics
Springfield School District
Enrollment: 280
Economically disadvantaged: 49%
Met or exceeded reading standards: 90.7%
Met or exceeded math standards: 57.4%
Met or exceeded writing standards: 65.4%
Met or exceeded science standards: 73.6%
Four year graduation rate: 84.1%
Prev
Next
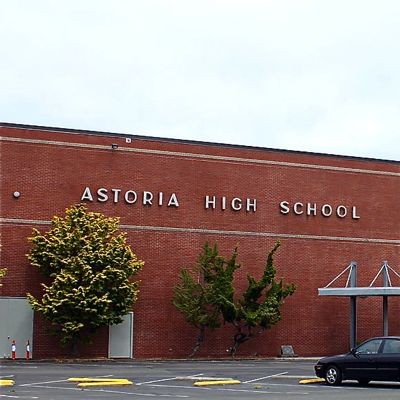
#90
Astoria Senior High
Astoria School District
Enrollment: 572
Economically disadvantaged: 48%
Met or exceeded reading standards: 93.1%
Met or exceeded math standards: 73.8%
Met or exceeded writing standards: 74.3%
Met or exceeded science standards: 52.7%
Four year graduation rate: 59.9%

Prev
Next
#89
Crane Union high School
Harney County Union High School District
Enrollment: 69
Economically disadvantaged: 39%
Met or exceeded reading standards: 97.5%
Met or exceeded math standards: 97.5%
Met or exceeded writing standards: 52.2%
Met or exceeded science standards: 69.6%
Four year graduation rate: 95%

Prev
Next
#88
Vale High
Vale School District
Enrollment: 234
Economically disadvantaged: 52%
Met or exceeded reading standards: 84.6%
Met or exceeded math standards: 64.6%
Met or exceeded writing standards: 63.1%
Met or exceeded science standards: 81.5%
Four year graduation rate: 88.2%

Prev
Next
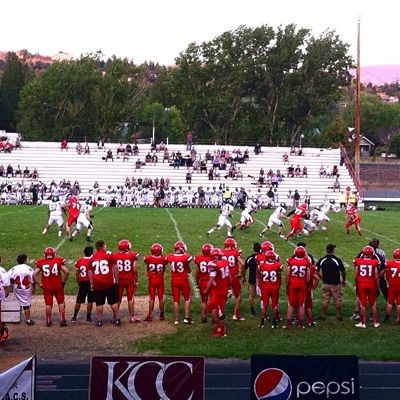
#87
Gold Beach High
Central Curry School District
Enrollment: 173
Economically disadvantaged: 57%
Met or exceeded reading standards: 91.9%
Met or exceeded math standards: 81.1%
Met or exceeded writing standards: 62.2%
Met or exceeded science standards: 80.8%
Four year graduation rate: 56.7%
Photo Credit: Google
Prev
Next
#86
Dallas High
Dallas School District
Enrollment: 979
Economically disadvantaged: 35%
Met or exceeded reading standards: 84.4%
Met or exceeded math standards: 72.8%
Met or exceeded writing standards: 49%
Met or exceeded science standards: 69.8%
Four year graduation rate: 52.9%
Photo Credit: Tedder - Own work. Licensed under CC BY 3.0 via Wikimedia Commons.
Prev
Next
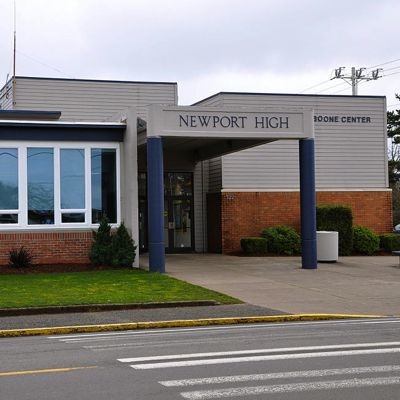
#85
Newport High School
Lincoln County School District
Enrollment: 528
Economically disadvantaged: 43%
Met or exceeded reading standards: 91.7%
Met or exceeded math standards: 81.7%
Met or exceeded writing standards: 62.6%
Met or exceeded science standards: 57.8%
Four year graduation rate: 70.7%
Photo Credit: Finetooth - Own work. Licensed under CC BY-SA 3.0 via Wikimedia Commons.
Prev
Next
#84
LaPine Senior High
Bend-LaPine School District
Enrollment: 439
Economically disadvantaged: 63%
Met or exceeded reading standards: 88.9%
Met or exceeded math standards: 72.4%
Met or exceeded writing standards: 47.5%
Met or exceeded science standards: 62.2%
Four year graduation rate: 74.7%
Photo Credit: samantha celera via Compfight cc

Prev
Next
#83
Aloha High
Beaverton School District
Enrollment: 1962
Economically disadvantaged: 61%
Met or exceeded reading standards: 82.7%
Met or exceeded math standards: 64.5%
Met or exceeded writing standards: 62.2%
Met or exceeded science standards: 60.2%
Four year graduation rate: 72.7%

Prev
Next
#82
La Grande High
La Grande School District
Enrollment: 560
Economically disadvantaged: 37%
Met or exceeded reading standards: 84.3%
Met or exceeded math standards: 60%
Met or exceeded writing standards: 56.4%
Met or exceeded science standards: 59.4%
Four year graduation rate: 74.1%
Photo Credit: Fiorenza Thompson via Compfight cc
Prev
Next
#81
Yoncalla High
Yoncalla School District
Enrollment: 87
Economically disadvantaged: 70%
Met or exceeded reading standards: 97.5%
Met or exceeded math standards: 58.8%
Met or exceeded writing standards: 64.7%
Met or exceeded science standards: 52.9%
Four year graduation rate: 78.8%
Visitor7 - Own work. Licensed under CC BY-SA 3.0 via Wikimedia Commons.
Prev
Next
#80
Elmira High
Fern Ridge School District
Enrollment: 436
Economically disadvantaged: 52%
Met or exceeded reading standards: 88.7%
Met or exceeded math standards: 70.1%
Met or exceeded writing standards: 63.5%
Met or exceeded science standards: 66.7%
Four year graduation rate: 77.6%
Photo Credit: Katr67 - Own work. Licensed under Public domain via Wikimedia Commons.

Prev
Next
#79
Churchill High
Eugene School District
Enrollment: 1020
Economically disadvantaged: 44%
Met or exceeded reading standards: 82.5%
Met or exceeded math standards: 73.6%
Met or exceeded writing standards: 68.8%
Met or exceeded science standards: 61.3%
Four year graduation rate: 69.2%
Photo Credit: EvelynGiggles via Compfight cc
Prev
Next
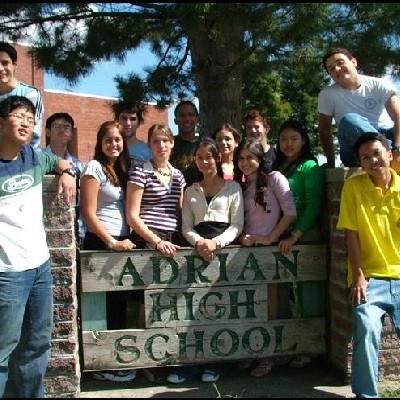
#78
Adrian High
Adrian School District
Enrollment: 64
Economically disadvantaged: 55%
Met or exceeded reading standards: 97.5%
Met or exceeded math standards: 57.1%
Met or exceeded writing standards: 71.4%
Met or exceeded science standards: 57.1%
Four year graduation rate: 95.5%
Prev
Next
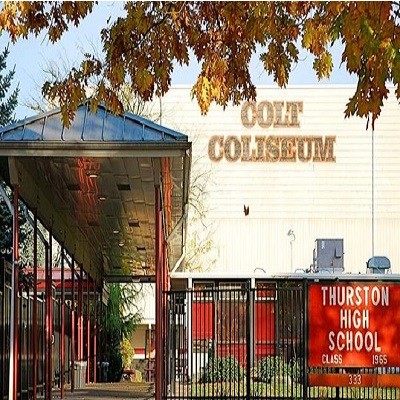
#77
Thurston High
Springfield School District
Enrollment: 1387
Economically disadvantaged: 42%
Met or exceeded reading standards: 85%
Met or exceeded math standards: 68.8%
Met or exceeded writing standards: 73.4%
Met or exceeded science standards: 57.6%
Four year graduation rate: 74.9%

Prev
Next
#76
North Medford High
Medford School District
Enrollment: 1612
Economically disadvantaged: 50%
Met or exceeded reading standards: 89.6%
Met or exceeded math standards: 74.6%
Met or exceeded writing standards: 55.1%
Met or exceeded science standards: 73.9%
Four year graduation rate: 68%
Photo Credit: theilr via Compfight cc
Prev
Next
#75
Klamath Union High
Klamath Falls City School District
Enrollment: 663
Economically disadvantaged: 56%
Met or exceeded reading standards: 81.9%
Met or exceeded math standards: 69.5%
Met or exceeded writing standards: 40.2%
Met or exceeded science standards: 54.8%
Four year graduation rate: 83.4%
Photo Credit: User:bobjgalindo - Own work. Licensed under CC BY-SA 3.0 via Wikimedia Commons.

Prev
Next
#74
Sandy High
Oregon Trail School District
Enrollment: 1286
Economically disadvantaged: 36%
Met or exceeded reading standards: 86.4%
Met or exceeded math standards: 69%
Met or exceeded writing standards: 59%
Met or exceeded science standards: 71.6%
Four year graduation rate: 76%

Prev
Next
#73
Henley High
Klamath County School District
Enrollment: 608
Economically disadvantaged: 33%
Met or exceeded reading standards: 86.7%
Met or exceeded math standards: 74.7%
Met or exceeded writing standards: 54.7%
Met or exceeded science standards: 64.7%
Four year graduation rate: 84.9%

Prev
Next
#72
Pendleton High
Pendleton School District
Enrollment: 881
Economically disadvantaged: 43%
Met or exceeded reading standards: 88.8%
Met or exceeded math standards: 82.7%
Met or exceeded writing standards: 49.7%
Met or exceeded science standards: 61.2%
Four year graduation rate: 75.5%
Prev
Next
#71
Cottage Grove High
South Lane School District
Enrollment: 761
Economically disadvantaged: 59%
Met or exceeded reading standards: 90.4%
Met or exceeded math standards: 70.9%
Met or exceeded writing standards: 54.6%
Met or exceeded science standards: 64%
Four year graduation rate: 87.6%
Photo Credit: Visitor7 - Own work. Licensed under CC BY-SA 3.0 via Wikimedia Commons.
Prev
Next
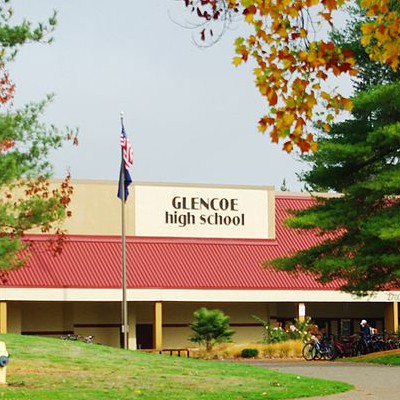
#70
Glencoe High
Hillsboro School District
Enrollment: 1601
Economically disadvantaged: 39%
Met or exceeded reading standards: 88.3%
Met or exceeded math standards: 70.5%
Met or exceeded writing standards: 58.4%
Met or exceeded science standards: 69.9%
Four year graduation rate: 77.1%
Prev
Next
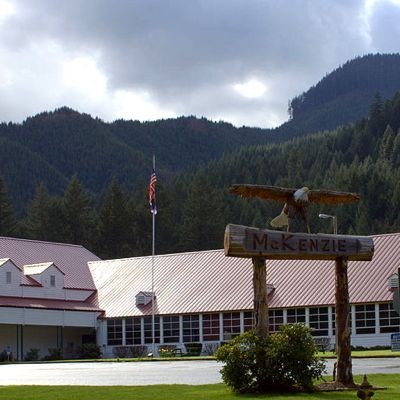
#69
McKenzie High
McKenzie School District
Enrollment: 67
Economically disadvantaged: 61%
Met or exceeded reading standards: 91.7%
Met or exceeded math standards: 41.7%
Met or exceeded writing standards: 50%
Met or exceeded science standards: 83.3%
Four year graduation rate: 68%
Photo Credit: Tedder - Own work. Licensed under CC BY 3.0 via Wikimedia Commons.

Prev
Next
#68
St. Helens High
St. Helens School District
Enrollment: 974
Economically disadvantaged: 36%
Met or exceeded reading standards: 91.4%
Met or exceeded math standards: 72.4%
Met or exceeded writing standards: 59.2%
Met or exceeded science standards: 66%
Four year graduation rate: 75.7%
Photo Credit: M.O. Stevens - Own work. Licensed under CC BY-SA 3.0 via Wikimedia Commons.
Prev
Next
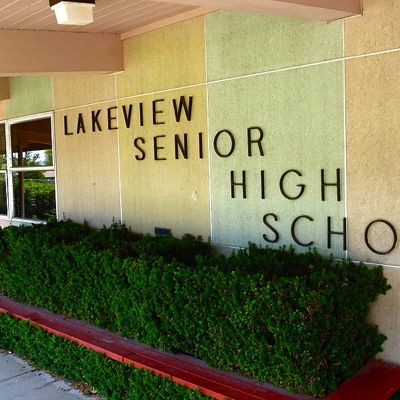
#67
Lakeview Senior High
Lake County School District
Enrollment: 223
Economically disadvantaged: 45%
Met or exceeded reading standards: 87.8%
Met or exceeded math standards: 69.4%
Met or exceeded writing standards: 66.7%
Met or exceeded science standards: 73.5%
Four year graduation rate: 88.1%
Prev
Next
#66
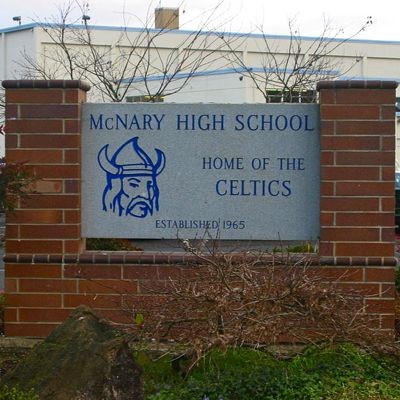
McNary High
Salem-Keizer School District
Enrollment: 1924
Economically disadvantaged: 49%
Met or exceeded reading standards: 89.8%
Met or exceeded math standards: 75%
Met or exceeded writing standards: 59.5%
Met or exceeded science standards: 66.1%
Four year graduation rate: 82%

Prev
Next
#65
Banks High
Banks School District
Enrollment: 384
Economically disadvantaged: 23%
Met or exceeded reading standards: 91.5%
Met or exceeded math standards: 79.8%
Met or exceeded writing standards: 57.4%
Met or exceeded science standards: 81.1%
Four year graduation rate: 80.6%
Photo Credit: valakirka via Compfight cc

Prev
Next
#64
Clackamas Middle College
North Clackamas School District
Enrollment: 290
Economically disadvantaged: 28%
Met or exceeded reading standards: 91.4%
Met or exceeded math standards: 76.3%
Met or exceeded writing standards: 59.3%
Met or exceeded science standards: 78%
Four year graduation rate: 32.6%
Photo Credit: slightly everything via Compfight cc

Prev
Next
#63
South Medford High
Medford School District
Enrollment: 1698
Economically disadvantaged: 56%
Met or exceeded reading standards: 87.9%
Met or exceeded math standards: 76.8%
Met or exceeded writing standards: 61.7%
Met or exceeded science standards: 71.2%
Four year graduation rate: 80.4%
Photo Credit: @RunRockPrincess via Compfight cc
Prev
Next
#62
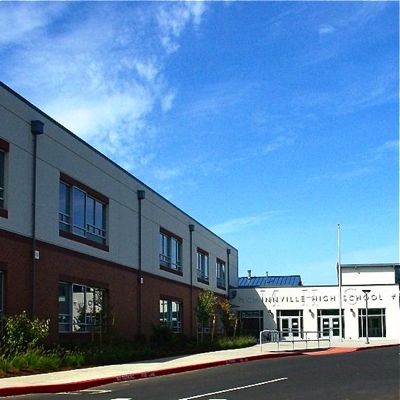
McMinnville High
McMinnville School District
Enrollment: 1864
Economically disadvantaged: 48%
Met or exceeded reading standards: 91.1%
Met or exceeded math standards: 73.3%
Met or exceeded writing standards: 66%
Met or exceeded science standards: 64.6%
Four year graduation rate: 77.1%

Prev
Next
#61
Estacada High
Estacada School District
Enrollment: 589
Economically disadvantaged: 46%
Met or exceeded reading standards: 89.9%
Met or exceeded math standards: 77.7%
Met or exceeded writing standards: 59%
Met or exceeded science standards: 66.4%
Four year graduation rate: 71.8%

Prev
Next
#60
Philomath High
Philomath School District
Enrollment: 519
Economically disadvantaged: 29%
Met or exceeded reading standards: 82.8%
Met or exceeded math standards: 75%
Met or exceeded writing standards: 56.3%
Met or exceeded science standards: 69.5%
Four year graduation rate: 75%

Prev
Next
#59
Weston-McEwen High
Athena-Weston School District
Enrollment: 164
Economically disadvantaged: 33%
Met or exceeded reading standards: 97.5%
Met or exceeded math standards: 61.1%
Met or exceeded writing standards: 76.5%
Met or exceeded science standards: 47.2%
Four year graduation rate: 75.7%
Prev
Next
#58
Grants Pass High
Grants Pass School District
Enrollment: 1734
Economically disadvantaged: 55%
Met or exceeded reading standards: 90.3%
Met or exceeded math standards: 68.8%
Met or exceeded writing standards: 68.3%
Met or exceeded science standards: 72.3%
Four year graduation rate: 69%

Prev
Next
#57
North Eugene High
Eugene School District
Enrollment: 927
Economically disadvantaged: 54%
Met or exceeded reading standards: 88.1%
Met or exceeded math standards: 71.2%
Met or exceeded writing standards: 68.3%
Met or exceeded science standards: 63%
Four year graduation rate: 70.7%
Prev
Next
#56
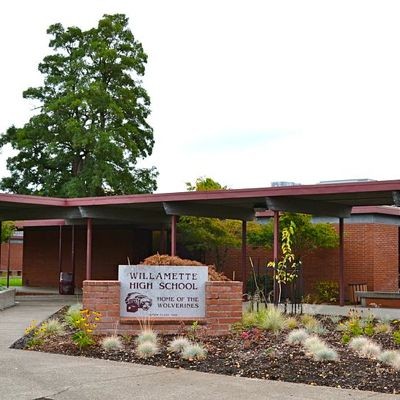
Willamette High
Bethel School District
Enrollment: 1452
Economically disadvantaged: 48%
Met or exceeded reading standards: 89.6%
Met or exceeded math standards: 69.5%
Met or exceeded writing standards: 77.1%
Met or exceeded science standards: 68.2%
Four year graduation rate: 73%

Prev
Next
#55
Putnam High
North Clackamas School District
Enrollment: 1196
Economically disadvantaged: 39%
Met or exceeded reading standards: 88.6%
Met or exceeded math standards: 73.4%
Met or exceeded writing standards: 69.9%
Met or exceeded science standards: 59.3%
Four year graduation rate: 75.7%

Prev
Next
#54
Neah-Kah-Nie High
Neah-Kah Nie School District
Enrollment: 181
Economically disadvantaged: 54%
Met or exceeded reading standards: 83.7%
Met or exceeded math standards: 58.5%
Met or exceeded writing standards: 41.9%
Met or exceeded science standards: 97.5%
Four year graduation rate: 87.5%
Photo Credit: albertogp123 via Compfight cc
Prev
Next
#53
Scappoose High
Scappoose School District
Enrollment: 692
Economically disadvantaged: 28%
Met or exceeded reading standards: 89.6%
Met or exceeded math standards: 85.2%
Met or exceeded writing standards: 54.6%
Met or exceeded science standards: 84.4%
Four year graduation rate: 80.6%
Prev
Next
#52
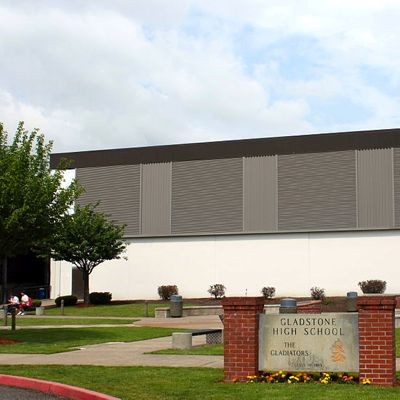
Gladstone High
Gladstone School District
Enrollment: 677
Economically disadvantaged: 40%
Met or exceeded reading standards: 88.7%
Met or exceeded math standards: 77.5%
Met or exceeded writing standards: 66%
Met or exceeded science standards: 82.2%
Four year graduation rate: 78.9%
Prev
Next
#51
Franklin High
Portland School District
Enrollment: 1387
Economically disadvantaged: 56%
Met or exceeded reading standards: 89.2%
Met or exceeded math standards: 77.7%
Met or exceeded writing standards: 68.1%
Met or exceeded science standards: 59.8%
Four year graduation rate: 78.4%
Prev
Next
#50
Seaside High
Seaside High School
Enrollment: 453
Economically disadvantaged: 52%
Met or exceeded reading standards: 91.2%
Met or exceeded math standards: 70.3%
Met or exceeded writing standards: 60.8%
Met or exceeded science standards: 65.3%
Four year graduation rate: 69.5%

Prev
Next
#49
Siuslaw High
Siuslaw School District
Enrollment: 409
Economically disadvantaged: 53%
Met or exceeded reading standards: 89.4%
Met or exceeded math standards: 65.1
Met or exceeded writing standards: 73.3%
Met or exceeded science standards: 77.1%
Four year graduation rate: 65.9%
_400_400_90.JPG)
Prev
Next
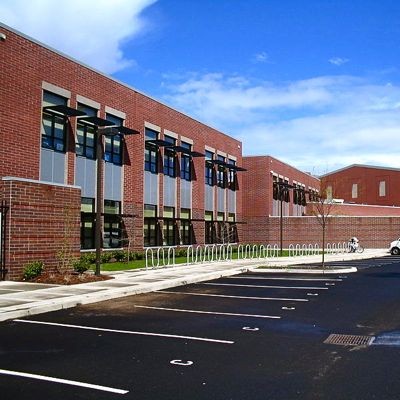
#48
Century High
Hillsboro School District
Enrollment: 1608
Economically disadvantaged: 43%
Met or exceeded reading standards: 87.8
Met or exceeded math standards: 78.6%
Met or exceeded writing standards: 62.7%
Met or exceeded science standards: 72.9%
Four year graduation rate: 84.8%

Prev
Next
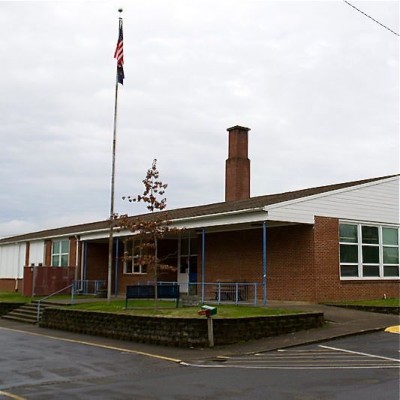
#47
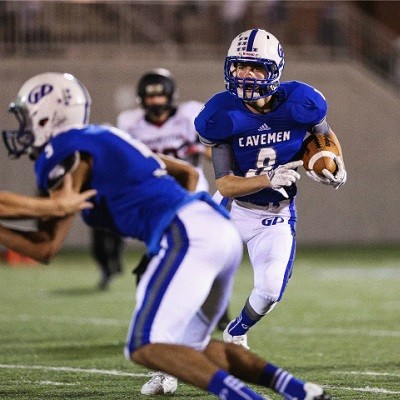
Junction City High
Junction City School District
Enrollment: 532
Economically disadvantaged: 54%
Met or exceeded reading standards: 85.6%
Met or exceeded math standards: 76.8%
Met or exceeded writing standards: 56.8%
Met or exceeded science standards: 64.8%
Four year graduation rate: 65.1%
Photo Credit: crazytales562 via Compfight cc
Prev
Next
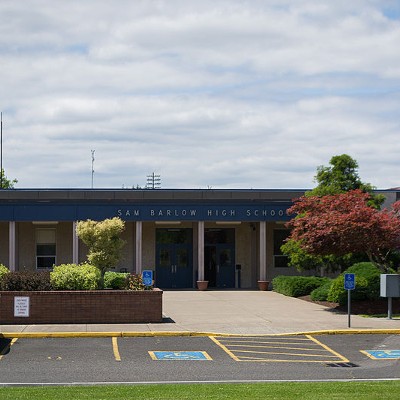
#46
Sam Barlow High
Gresham-Barlow School District
Enrollment: 1651
Economically disadvantaged: 38%
Met or exceeded reading standards: 84.5%
Met or exceeded math standards: 78.4%
Met or exceeded writing standards: 68.8%
Met or exceeded science standards: 76.7%
Four year graduation rate: 81.8%
Prev
Next
#45
Forest Grove High
Forrest Grove School District
Enrollment: 1779
Economically disadvantaged: 59%
Met or exceeded reading standards: 89.4%
Met or exceeded math standards: 85.7%
Met or exceeded writing standards: 66.6%
Met or exceeded science standards: 61.1%
Four year graduation rate: 72.5%
Prev
Next
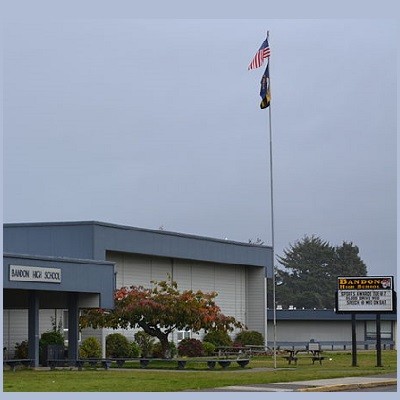
#44
Bandon Senior High
Bandon School District
Enrollment: 242
Economically disadvantaged: 60%
Met or exceeded reading standards: 86.1%
Met or exceeded math standards: 68.1%
Met or exceeded writing standards: 56.3%
Met or exceeded science standards: 70.4%
Four year graduation rate: 72.9%

Prev
Next
#43
South Salem High
Salem-Keizer School District
Enrollment: 1835
Economically disadvantaged: 49%
Met or exceeded reading standards: 89.5%
Met or exceeded math standards: 73.3%
Met or exceeded writing standards: 66.2%
Met or exceeded science standards: 66.5%
Four year graduation rate: 81.9%

Prev
Next
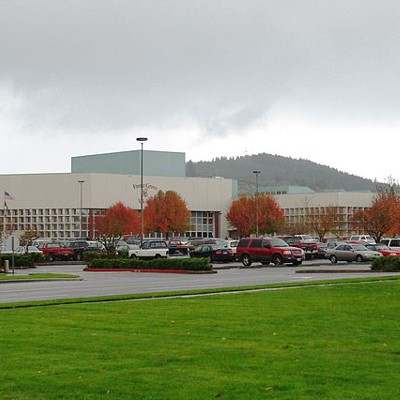
#42
Hood River Valley High
Hood River County School District
Enrollment: 1218
Economically disadvantaged: 57%
Met or exceeded reading standards: 87.1%
Met or exceeded math standards: 78.5%
Met or exceeded writing standards: 69.7%
Met or exceeded science standards: 53.5%
Four year graduation rate: 77.4%

Prev
Next
#41
North Douglas High
North Doughlas School District
Enrollment: 98
Economically disadvantaged: 45%
Met or exceeded reading standards: 91.3%
Met or exceeded math standards: 78.3%
Met or exceeded writing standards: 72.7%
Met or exceeded science standards: 60.9%
Four year graduation rate: 69%

Prev
Next
#40
Baker High
Baker School District
Enrollment: 501
Economically disadvantaged: 47%
Met or exceeded reading standards: 84.6%
Met or exceeded math standards: 73.6%
Met or exceeded writing standards: 65.9%
Met or exceeded science standards: 75.3%
Four year graduation rate: 77.8%
Prev
Next
#39
Oakland High
Oakland School District
Enrollment: 185
Economically disadvantaged: 50%
Met or exceeded reading standards: 91.5
Met or exceeded math standards: 83%
Met or exceeded writing standards: 68.1%
Met or exceeded science standards: 83%
Four year graduation rate: 86.1%
Prev
Next
#38
Newberg Senior High
Newberg School District
Enrollment: 1508
Economically disadvantaged: 42%
Met or exceeded reading standards: 87.9%
Met or exceeded math standards: 77.6%
Met or exceeded writing standards: 71.8%
Met or exceeded science standards: 68.3%
Four year graduation rate: 78.2%

Prev
Next
#37
West Salem High
Salem-Keizer School District
Enrollment: 1646
Economically disadvantaged: 35%
Met or exceeded reading standards: 92.7%
Met or exceeded math standards: 83.5%
Met or exceeded writing standards: 74.6%
Met or exceeded science standards: 74.2%
Four year graduation rate: 86.3%

Prev
Next
#36
Canby High
Canby School District
Enrollment: 1481
Economically disadvantaged: 32%
Met or exceeded reading standards: 87.3%
Met or exceeded math standards: 84%
Met or exceeded writing standards: 71.5%
Met or exceeded science standards: 61.6%
Four year graduation rate: 82.5%

Prev
Next
#35
Burns High
Harney County School District
Enrollment: 208
Economically disadvantaged: 33%
Met or exceeded reading standards: 76.2%
Met or exceeded math standards: 69%
Met or exceeded writing standards: 40.5%
Met or exceeded science standards: 83.3%
Four year graduation rate: 96.2%
Prev
Next
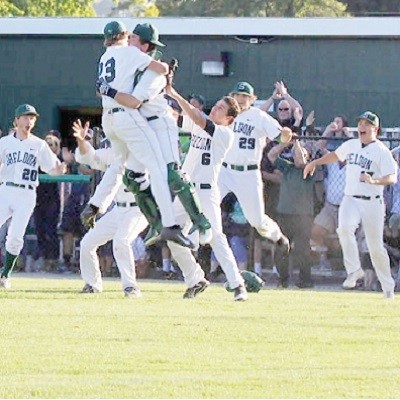
#34
Sheldon High
Eugene School District
Enrollment: 1399
Economically disadvantaged: 29%
Met or exceeded reading standards: 91.4%
Met or exceeded math standards: 77.7%
Met or exceeded writing standards: 69.1%
Met or exceeded science standards: 76.6%
Four year graduation rate: 72.4%
Prev
Next
#33
Oregon City Senior High
Oregon City School District
Enrollment: 2117
Economically disadvantaged: 34%
Met or exceeded reading standards: 97.5%
Met or exceeded math standards: 90.8%
Met or exceeded writing standards: 63%
Met or exceeded science standards: 76.7%
Four year graduation rate: 83%
Prev
Next
#32
Beaverton High
Beaverton School District
Enrollment: 1588
Economically disadvantaged: 43%
Met or exceeded reading standards: 90%
Met or exceeded math standards: 76.7%
Met or exceeded writing standards: 70.7%
Met or exceeded science standards: 65.4%
Four year graduation rate: 74.2%
Prev
Next
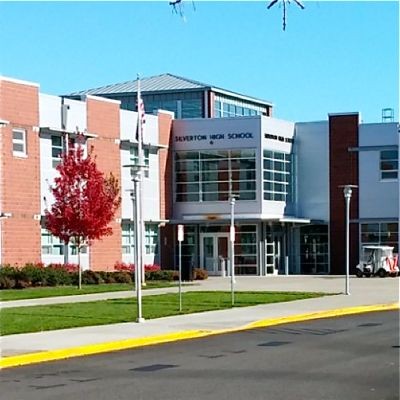
#31
Silverton High
Silver Falls School District
Enrollment: 1179
Economically disadvantaged: 41%
Met or exceeded reading standards: 86.1%
Met or exceeded math standards: 74.1%
Met or exceeded writing standards: 71.9%
Met or exceeded science standards: 72.1 %
Four year graduation rate: 77.7%
Prev
Next
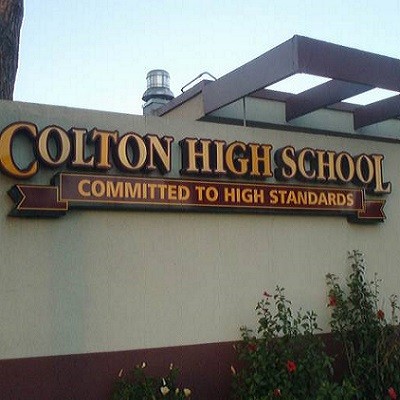
#30
Colton High
Colton School District
Enrollment: 215
Economically disadvantaged: 28%
Met or exceeded reading standards: 90%
Met or exceeded math standards: 76%
Met or exceeded writing standards: 68%
Met or exceeded science standards: 85.1%
Four year graduation rate: 95.2%

Prev
Next
#29
Bend Senior High
Bend-LaPine School District
Enrollment: 1527
Economically disadvantaged: 40%
Met or exceeded reading standards: 92.7%
Met or exceeded math standards: 88.4%
Met or exceeded writing standards: 65.9%
Met or exceeded science standards: 75.6%
Four year graduation rate: 78.7%

Prev
Next
#28
Tualatin High
Tigard-Tualatin School District
Enrollment: 1714
Economically disadvantaged: 27%
Met or exceeded reading standards: 92.2%
Met or exceeded math standards: 76.7%
Met or exceeded writing standards: 62.9%
Met or exceeded science standards: 71.4%
Four year graduation rate: 84.4%

Prev
Next
#27
Mountain View Senior High
Bend-LaPine School District
Enrollment: 1283
Economically disadvantaged: 42%
Met or exceeded reading standards: 93.7%
Met or exceeded math standards: 82%
Met or exceeded writing standards: 75.2%
Met or exceeded science standards: 76.1%
Four year graduation rate: 78.3%
Photo Credit: Vince Kusters via Compfight cc

Prev
Next
#26
Tigard High
Tigard-Tualatin School District
Enrollment: 1835
Economically disadvantaged: 32%
Met or exceeded reading standards: 92.7%
Met or exceeded math standards: 83.5%
Met or exceeded writing standards: 64.5%
Met or exceeded science standards: 67.7%
Four year graduation rate: 80.8%
Prev
Next
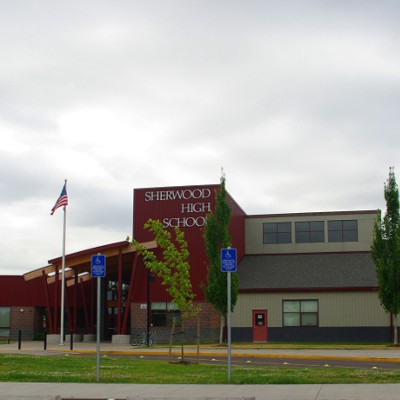
#25
Sherwood High
Sherwood School District
Enrollment: 1469
Economically disadvantaged: 15%
Met or exceeded reading standards: 97.5%
Met or exceeded math standards: 85.8%
Met or exceeded writing standards: 62.2%
Met or exceeded science standards: 84.8%
Four year graduation rate: 91.3%
Prev
Next
#24
Corvallis High
Corvallis School District
Enrollment: 1184
Economically disadvantaged: 32%
Met or exceeded reading standards: 87.5%
Met or exceeded math standards: 79.8%
Met or exceeded writing standards: 69.2%
Met or exceeded science standards: 76.4%
Four year graduation rate: 70.7%

Prev
Next
#23
Sprague High
Salem-Keizer School District
Enrollment: 1608
Economically disadvantaged: 32%
Met or exceeded reading standards: 97.5%
Met or exceeded math standards: 86.2%
Met or exceeded writing standards: 72.5%
Met or exceeded science standards: 79.6%
Four year graduation rate: 82.2%
Photo Credit: Jirka Matousek via Compfight cc
Prev
Next
#22
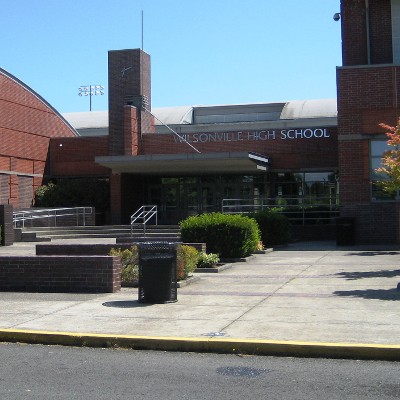
Wilsonville High
West Linn-Wilsonville School District
Enrollment: 1093
Economically disadvantaged: 24%
Met or exceeded reading standards: 92.5%
Met or exceeded math standards: 74.1%
Met or exceeded writing standards: 74.2%
Met or exceeded science standards: 71.3%
Four year graduation rate: 85%

Prev
Next
#21
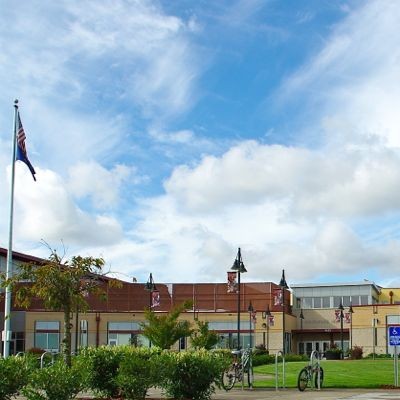
West Albany High
Greater Albany Public School District
Enrollment: 1317
Economically disadvantaged: 28%
Met or exceeded reading standards: 92.3%
Met or exceeded math standards: 87.5%
Met or exceeded writing standards: 75%
Met or exceeded science standards: 84.9%
Four year graduation rate: 93.6%
Photo Credit: jonas maaloe via Compfight cc

Prev
Next
#20
Clackamas High
North Clackamas School District
Enrollment: 2230
Economically disadvantaged: 29%
Met or exceeded reading standards: 91.7%
Met or exceeded math standards: 85.7%
Met or exceeded writing standards: 80.5%
Met or exceeded science standards: 74.2%
Four year graduation rate: 85.5%
Prev
Next
#19
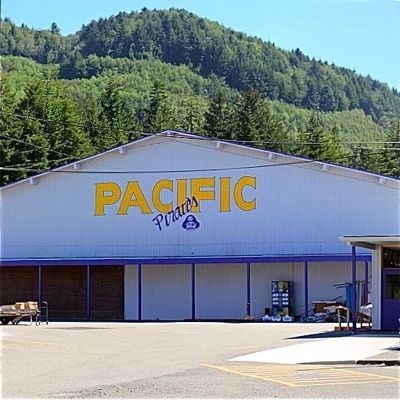
Pacific High
Port Orford-Langlois School District
Enrollment: 90
Economically disadvantaged: 53%
Met or exceeded reading standards: 90.9%
Met or exceeded math standards: 59.1%
Met or exceeded writing standards: 77.3%
Met or exceeded science standards: 68.2%
Four year graduation rate: 78.3%
Photo Credit: Tedder - Own work. Licensed under CC BY 3.0 via Wikimedia Commons.
Prev
Next
#18
Southridge High
Beaverton School District
Enrollment: 1722
Economically disadvantaged: 27%
Met or exceeded reading standards: 91.5%
Met or exceeded math standards: 80.4%
Met or exceeded writing standards: 66.3%
Met or exceeded science standards: 68.9%
Four year graduation rate: 88.5%
Prev
Next
#17
Sisters High
Sisters School District
Enrollment: 480
Economically disadvantaged: 28%
Met or exceeded reading standards: 93.5%
Met or exceeded math standards: 74.1%
Met or exceeded writing standards: 77.8%
Met or exceeded science standards: 83.3%
Four year graduation rate: 88.4%

Prev
Next
#16
Glide High
Glide School District
Enrollment: 215
Economically disadvantaged: 45%
Met or exceeded reading standards: 97.5%
Met or exceeded math standards: 70.8%
Met or exceeded writing standards: 68.8%
Met or exceeded science standards: 93.8%
Four year graduation rate: 86.7%
Photo Credit: racka_abe via Compfight cc

Prev
Next
#15
Summit High
Bend-LaPine School District
Enrollment: 1344
Economically disadvantaged: 22%
Met or exceeded reading standards: 93.3%
Met or exceeded math standards: 74.6%
Met or exceeded writing standards: 73.6%
Met or exceeded science standards: 73.6%
Four year graduation rate: 88.3%
Photo Credit: frankjuarez via Compfight cc

Prev
Next
#14
Grant High
Portland School District
Enrollment: 1489
Economically disadvantaged: 24%
Met or exceeded reading standards: 92.6%
Met or exceeded math standards: 83.3%
Met or exceeded writing standards: 70.3%
Met or exceeded science standards: 66.4%
Four year graduation rate: 84.3%
Prev
Next
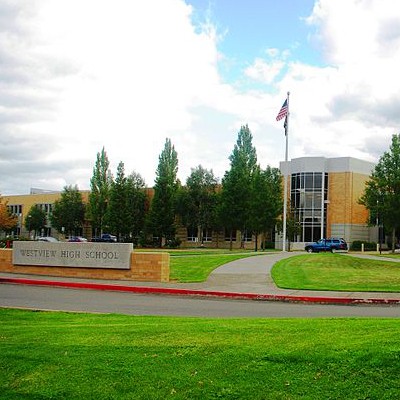
#13
Westview High
Beaverton School District
Enrollment: 2418
Economically disadvantaged: 33%
Met or exceeded reading standards: 92.2%
Met or exceeded math standards: 81.8%
Met or exceeded writing standards: 75.4%
Met or exceeded science standards: 70.3%
Four year graduation rate: 80.1%
Prev
Next
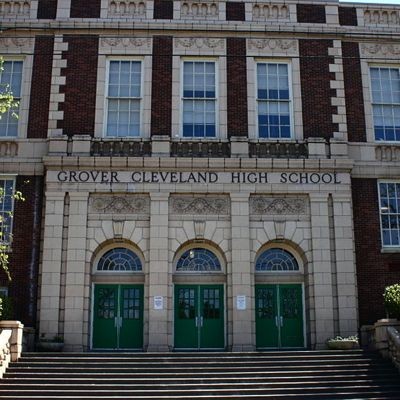
#12
Cleveland High
Portland School District
Enrollment: 1457
Economically disadvantaged: 29%
Met or exceeded reading standards: 92.6%
Met or exceeded math standards: 80.2%
Met or exceeded writing standards: 81.4%
Met or exceeded science standards: 59.7%
Four year graduation rate: 76.2%
Tedder - Own work. Licensed under CC BY 3.0 via Wikimedia Commons.

Prev
Next
#11
Sunset High
Beaverton School District
Enrollment: 1942
Economically disadvantaged: 29%
Met or exceeded reading standards: 94.7%
Met or exceeded math standards: 83.3%
Met or exceeded writing standards: 76.8%
Met or exceeded science standards: 79.7%
Four year graduation rate: 81.4%

Prev
Next
#10
Wilson High
Portland School District
Enrollment: 1185
Economically disadvantaged: 22%
Met or exceeded reading standards: 91.8%
Met or exceeded math standards: 80.4%
Met or exceeded writing standards: 82.8%
Met or exceeded science standards: 63.8%
Four year graduation rate: 84.4%
Photo Credit: KristinNador via Compfight cc

Prev
Next
#9
Ashland High
Ashland School District
Enrollment: 940
Economically disadvantaged: 28%
Met or exceeded reading standards: 97.5%
Met or exceeded math standards: 85.8%
Met or exceeded writing standards: 79.8%
Met or exceeded science standards: 77.2%
Four year graduation rate: 86.1%
Prev
Next
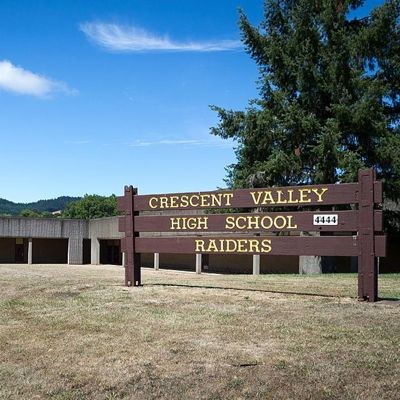
#8
Crescent Valley High
Corvallis School District
Enrollment: 965
Economically disadvantaged: 23%
Met or exceeded reading standards: 97.5%
Met or exceeded math standards: 85.3%
Met or exceeded writing standards: 78.1%
Met or exceeded science standards: 77.8%
Four year graduation rate: 70.1%
Photo Credit: Visitor7 - Own work. Licensed under CC BY-SA 3.0 via Wikimedia Commons.

Prev
Next
#7
West Linn High
West Linn-Wilsonville School District
Enrollment: 1514
Economically disadvantaged: 10%
Met or exceeded reading standards: 97.5%
Met or exceeded math standards: 87.9%
Met or exceeded writing standards: 85.8%
Met or exceeded science standards: 83.2%
Four year graduation rate: 93.2%
Photo Credit: Tedder - Own work. Licensed under CC BY 3.0 via Wikimedia Commons.

Prev
Next
#6
Riverdale High
Riverdale School District
Enrollment: 242
Economically disadvantaged: <6%*
Met or exceeded reading standards: 97.5%
Met or exceeded math standards: 89.8%
Met or exceeded writing standards: 74.6%
Met or exceeded science standards: 74.6%
Four year graduation rate: 94.2%
*numbers less than 6% are represented by an asterisk in the Oregon Department of Education data.

Prev
Next
#5
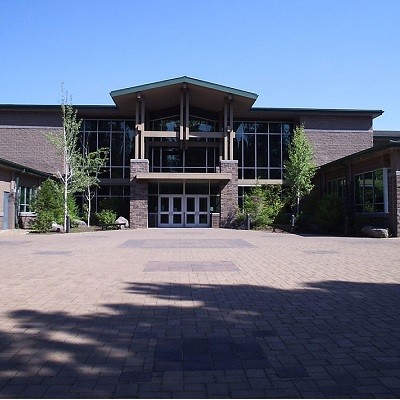
School of Science & Technology
Beaverton School District
Enrollment: 167
Economically disadvantaged: 20%
Met or exceeded reading standards: 97.5%
Met or exceeded math standards: 97.5%
Met or exceeded writing standards: 86%
Met or exceeded science standards: 63.9%
Four year graduation rate: 81.1%
Photo Credit: Maya83 via Compfight cc
Prev
Next
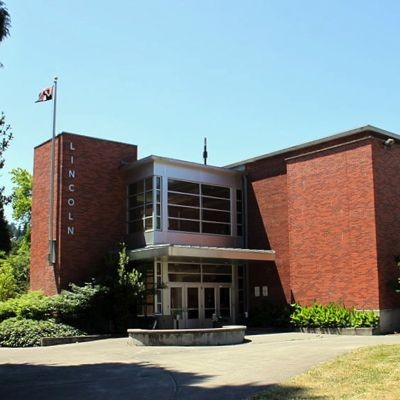
#4
Lincoln High
Portland School District
Enrollment: 1471
Economically disadvantaged: 12%
Met or exceeded reading standards: 92.5%
Met or exceeded math standards: 85.3%
Met or exceeded writing standards: 88.1%
Met or exceeded science standards: 79.9%
Four year graduation rate: 89.3%
Photo Credit: Tedder - Own work. Licensed under CC BY 3.0 via Wikimedia Commons.
Prev
Next
#3
Lakeridge High
Lake Oswego School District
Enrollment: 1078
Economically disadvantaged: 8%
Met or exceeded reading standards: 97.5%
Met or exceeded math standards: 93.9%
Met or exceeded writing standards: 91.8%
Met or exceeded science standards: 92.1%
Four year graduation rate: 89.8%

Prev
Next
#2
South Eugene High
Eugene School District
Enrollment: 1321
Economically disadvantaged: 24%
Met or exceeded reading standards: 97.5%
Met or exceeded math standards: 91.6%
Met or exceeded writing standards: 84.9%
Met or exceeded science standards: 89.2%
Four year graduation rate: 79.4%
Photo Credit: katalicia1 via Compfight cc

Prev
Next
#1
Lake Oswego Senior High
Lake Oswego School District
Enrollment: 1224
Economically disadvantaged: 6%
Met or exceeded reading standards: 97.5%
Met or exceeded math standards: 92.4%
Met or exceeded writing standards: 89.1%
Met or exceeded science standards: 87.7%
Four year graduation rate: 89.5%
Photo Credit: KristinNador via Compfight cc
Related Articles
Enjoy this post? Share it with others.
Email to a friend
Permalink


_80_80_90_c1.JPG)


Follow us on Pinterest Google + Facebook Twitter See It Read It