Welcome! Login | Register
 

Derek Jeter, Kobe Bryant, Tom Brady … Russell Wilson?—Derek Jeter, Kobe Bryant, Tom Brady … Russell…

U.S. Unemployment Claims Soar to Record-Breaking 3.3 Million During Coronavirus Crisis—U.S. Unemployment Claims Soar to Record-Breaking 3.3 Million…

Harlem Globetrotters Icon Fred “Curley” Neal Passes Away at 77—Harlem Globetrotters Icon Fred “Curley” Neal Passes Away…

Boredom Busters – 3 Games The Family Needs While The World Waits For Sports—Boredom Busters – 3 Games The Family Needs…

REPORT: 2020 Olympics to be Postponed Due to Coronavirus Emergency—REPORT: 2020 Olympics to be Postponed Due to…

Convicted Rapist Weinstein Has Coronavirus, According to Reports—Convicted Rapist Weinstein Has Coronavirus, According to Reports

“Does Anyone Care About Politics Right Now?”—Sunday Political Brunch March 22, 2020—“Does Anyone Care About Politics Right Now?” --…

U.S. - Canada Border to Close for Non-Essential Travel—U.S. - Canada Border to Close for Non-Essential…

Broken Hearts & Lost Games – How The Coronavirus Affected Me—Broken Hearts & Lost Games – How The…

White House Considering Giving Americans Checks to Combat Economic Impact of Coronavirus—White House Considering Giving Americans Checks to Combat…


slides: 10 Oregon Towns with the Most Hate Crimes in 2013

Friday, December 12, 2014


Toledo Oregon had more per capita hate crimes than any other city in the state of Oregon, according to the most recent FBI data released Monday.

The data in the report was compiled from self-reported statistics from 2013.  Twelve Oregon cities and six counties submitted their records.

Slideshow Below: Oregon Towns with the Most Hate Crimes

This was the first year, that the crimes were broken down by motivation, which included bias against race, ethnicity, sexual orientation, disability, gender, and gender identity.  Overall, 66 hate crimes were reported to the FBI from across the state. 

Hate crimes in Oregon are relatively rare, and can range from property crimes to assault.

On Friday December 5th Lee Hayward, 44, reported to police that he was beaten by two of his coworkers in downtown Portland because he was gay.

More: Lee Hayward’s Experience With Alleged Hate Crime

However, in 2013, The City of Portland only reported 6 bias-based crimes across all categories. The neighboring city of Tigard, reported 9, comparatively high for a community of a little over 50,000.

Tigard saw 8 racially motivated hate crimes, and one crime based on ethnicity, last year. Most of the incidents were property damage and included graffiti of swastikas and racial epiphytes.

One incident was an assault of a black man who was attacked at a bar because he was with a white woman, according to Jim Wolf, Tigard Police spokesman.

Wolf said that he didn’t think that the FBI statistics were remarkable.  

“Most if not all suburban areas in the metro area would likely have similar types of incidences,” Wolf said. “I don't see any factors that would point to any particular problem in Tigard.”

The only other city in the Portland metro area to make the FBI hate crime list was Beaverton, with one incident in 2013. Portland had the lowest per capita hate crime rate in 2013, with .01 hate crimes per 1,000 residents.

Sgt Pete Simpson, spokesman for the Portland Police Bureau, was not surprised by the low rate of bias crimes in the city.

“Portland is very diverse city. People here are very accepting and supportive of difference,” Simpson said. “We [police] also take these crimes very seriously.  There is a zero tolerance for that sort of thing here. It’s all part of what makes it a great city.”

New Data Reveals Motivations

This year’s Uniform Crime Reporting (UCR) data bias crime motivation in response to the Matthew Shepard James Byrd Jr. Hate Crimes Prevention Act of 2009, according to the Bureau.

The purpose of the Hate Crime Statistics Program is to gain additional insight into the nature of these crimes and some information about the victims and offenders. The report stated that, "hate crimes are not separate, distinct crimes; instead, they are traditional offenses motivated by the offender’s bias (for example, an offender assaults a victim because of a bias against the victim’s race)."


Related Slideshow: Top 10 Oregon Cities for Hate Crimes

Every year, the FBI releases hate crime statistics from around the state. Check out what the worst towns for hate crimes were in 2013. 

Prev Next

#10

Bend

Total Hate Crimes: 3

Types of Hate Crimes: 2 against religion, 1 against ethnicity

Hate Crimes Per 1,000 People: 0.038

Photo: Farewell Bend Park, via Wikimedia Commons

Prev Next

#9

Newberg-Dundee

Total Hate Crimes: 1

Type of Hate Crime: 1 against ethnicity

Hate Crimes Per 1,000 People: 0.039

Photo: Newberg Public Library, Stuart Seeger on Flickr

Prev Next

#8

Ashland

Total Hate Crimes: 1

Type of Hate Crime: 1 against race

Hate Crimes Per 1,000 People: 0.049

Photo Credit: The Plaza in Ashland, via Wikimedia Commons

Prev Next

#7

Springfield

Total Hate Crimes: 3

Types of Hate Crimes: 2 against race, 1 against ethnicity 

Hate Crimes Per 1,000 People: 0.050

Photo: Gateway Mall in Springfield

Prev Next

#6

Salem

Total Hate Crimes: 14

Types of Hate Crimes: 7 against race, 1 against religion, 4 against sexual orientation, 2 against ethnicity

Hate Crimes Per 1,000 People: 0.088

Prev Next

#5

Eugene

Total Hate Crimes: 15

Types of Hate Crimes: 6 against race, 4 against religion, 3 against sexual orientation, 2 against ethnicity

Hate Crimes Per 1,000 People: 0.095

Photo: University of Oregon in Eugene

Prev Next

#4

Newport

Total Hate Crimes: 1

Type of Hate Crime: 1 against sexual orientation

Hate Crimes Per 1,000 People: 0.10

Photo: Harbor in Yaquina Bay, Newport, via Wikimedia Commons

Prev Next

#3

Sutherlin

Total Hate Crimes: 1

Type of Hate Crime: 1 against race

Hate Crimes Per 1,000 People: 0.129

Photo: Brett Spangler on Flickr

Prev Next

#2

Tigard

Total Hate Crimes: 9

Types of Hate Crimes: 8 against race, 1 against ethnicity

Hate Crimes Per 1,000 People: 0.179

Photo: Loren Kerns on Flickr

Prev Next

#1

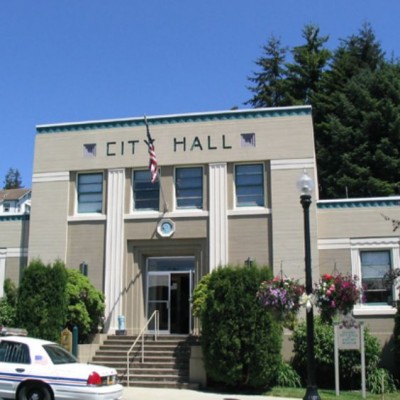
Toledo

Total Hate Crimes: 4

Types of Hate Crimes: 2 against race, 1 against sexual orientation, 1 against disability

Hate Crimes Per 1,000 People: 1.156

Photo: Toledo city hall, via Wikimedia Commons 


Related Articles


Enjoy this post? Share it with others.

 
Delivered Free Every
Day to Your Inbox