slides: Portland Metro’s Top High Schools


 Email to a friend
Permalink
Email to a friend
Permalink
Sunday, August 31, 2014
Shelby Sebens, GoLocalPDX Reporter
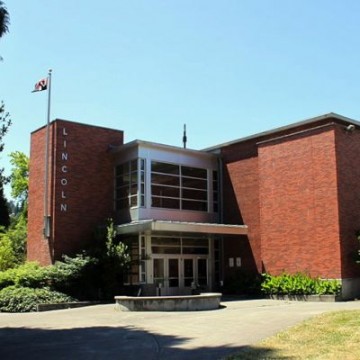
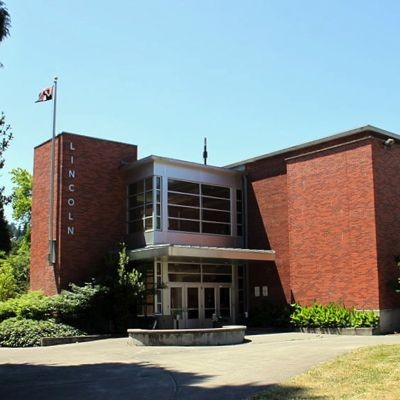
Lincoln High School ranked third for top high schools in the Portland Metro area.
GoLocalPDX has crunched the numbers and the test results are in – Lake Oswego Senior High School makes the grade as Portland metro’s top high school for 2014.
Slideshow Below: Portland Metro's Top High Schools
GoLocal employs a formula developed at Babson College to assess and weight each school's latest SAT scores, plus per-pupil funding, student-teacher ratios, and graduation rates. All data is the latest available from the Oregon Department of Education’s public database as of August 2014.
Success stories
What makes a top high school?
Peyton Chapman, principal at Lincoln High School, which ranked fourth, said school success depends on support and resources.
“There are multiple factors,” she said. “I think one of the most important is the quality of teachers and we have an excellent faculty and certainly very involved families who not only have the commitment to education, but also have the time and resources to be supportive of the students.”
Chapman added that Lincoln encourages the students to chase their ambitions.
“It’s really cool, the culture,” she said. “It’s very cool to be smart and follow your passions at Lincoln.”
Piquing their interest
From math club to drumline to sports, students get the chance to learn based on their interests, Chapman said.
For example, students expressed interest in capitalizing on Portland’s foodie vibe so the school created a culinary arts program. Now 300 students are working with local chefs, creating business plans for food carts and blogging about food.
When comparing schools statewide, South Eugene High School and Ashland High School ranked high on the list. Ashland came in ninth and South Eugene was second.
“I really do believe that it’s a kindergarten through 12th-grade effort,” Ashland Principal Michelle Zundel said. “It is an incredible testimony to the hard work of our students. We also have extraordinary teachers who are really on the top of their game.”
Lou Bailey, principal of West Linn High School, which ranked seventh, said the school consistently ranks high for graduation rates.
“That just goes back to a lot of hard work from folks here in the building," he said.
Making the grade
While some schools did not have SAT scores available and therefore were not ranked, they did well in meeting state benchmarks.
Milwaukie Academy of the Arts, for example, ranked high for meeting or exceeding state standards and had a graduation rate of 93 percent.
Mark Pinder, principal of Milwaukie Academy of the Arts, attributes the school’s success to looking at areas that need improvement and taking steps to get better.
“What we’ve had to do is adjust how we are teaching,” he said. “Every kid is different who comes to us, so we have to look at what is the support they need.”
Pinder said the school opened a food pantry to get food to students during the school day. The Oregon Food Bank also runs a vegetable and fruit giveaway once a month. About 40 percent of the students are economically disadvantaged, according to the 2012-13 Oregon Report Card.
Pinder said rankings are important, but cautioned that it makes more sense to compare schools that have similar demographics.
He said Milwaukie’s graduate rate for Hispanics increased last year to 74 percent, surpassing the white graduation rate at 71 percent.
Pinder said a high ranking when compared to other high schools is just one way to show the school is doing well.
“I think it’s important for us to say, ‘Hey this validates the work that we’ve been doing,” Pinder said. “I think an improvement also validates the work that you’re doing.”
Bailey said that while West Linn is pleased with its success, it's not resting on its laurels.
“There’s room for improvement. We don’t ever just sit by," he said. "We’re going to continue getting better."
Related Slideshow: Slideshow: Top Portland Metro High Schools
GoLocalPDX has ranked the top high schools in the metro area using a method developed in Babson College, Mass. High schools were ranked based on complete data available.
Prev
Next
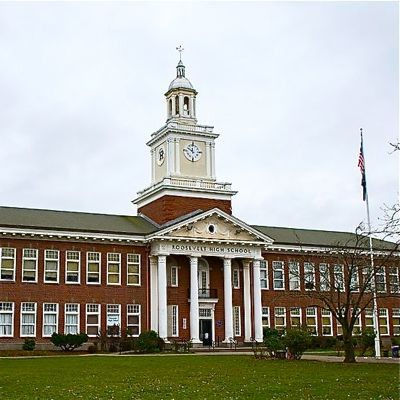
#46
Roosevelt High
Multnomah County
Enrollment: 771
Economically disadvantaged: 76%
Met or exceeded reading standards: 78.1%
Met or exceeded math standards: 59%
Met or exceeded writing standards: 47.9%
Met or exceeded science standards: 19.5%
Four year graduation rate: 69.9%
Photo Credit: Visitor7 - Own work. Licensed under CC BY-SA 3.0 via Wikimedia Commons.

Prev
Next
#45
Madison High
Multnomah County
Enrollment: 1025
Economically disadvantaged: 68%
Met or exceeded reading standards: 72.2%
Met or exceeded math standards: 64.9%
Met or exceeded writing standards: 51.3%
Met or exceeded science standards: 37.4%
Four year graduation rate: 71%
Photo Credit: kamera kızı via Compfight cc
Prev
Next
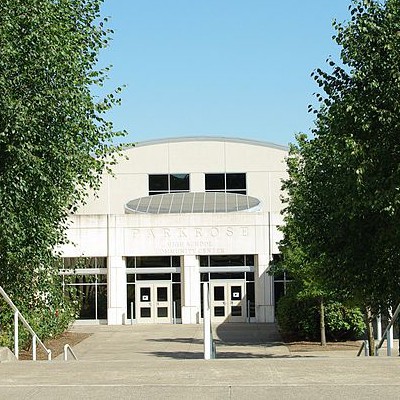
#44
Parkrose High
Multnomah County
Enrollment: 951
Economically disadvantaged: 68%
Met or exceeded reading standards: 83.5%
Met or exceeded math standards: 65.3%
Met or exceeded writing standards: 53.6%
Met or exceeded science standards: 52.6%
Four year graduation rate: 69%
Photo Credit: M.O. Stevens - Own work. Licensed under CC BY-SA 3.0 via Wikimedia Commons
Prev
Next
#43
David Douglas High
Multnomah County
Enrollment: 3027
Economically disadvantaged: 74%
Met or exceeded reading standards: 78.2%
Met or exceeded math standards: 61.9%
Met or exceeded writing standards: 52.2%
Met or exceeded science standards: 52.9%
Four year graduation rate: 71.6%

Prev
Next
#42
Alliance High
Multnomah County
Enrollment: 224
Economically disadvantaged: 58%
Met or exceeded reading standards: 73.5%
Met or exceeded math standards: 42.5%
Met or exceeded writing standards: 33.3%
Met or exceeded science standards: 43.2%
Four year graduation rate: 20.9%
Photo Credit: @RunRockPrincess viaCompfight cc
Prev
Next
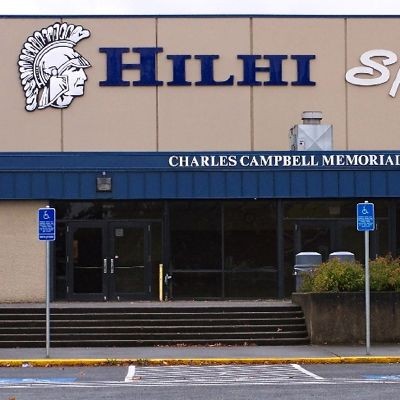
#41
Hillsboro High
Washington County
Enrollment: 1315
Economically disadvantaged: 55%
Met or exceeded reading standards: 77.3%
Met or exceeded math standards: 68.1%
Met or exceeded writing standards: 52.6%
Met or exceeded science standards: 38.4%
Four year graduation rate: 71.6%
Photo Credit: M.O. Stevens - via Wikimedia Commons.
Prev
Next
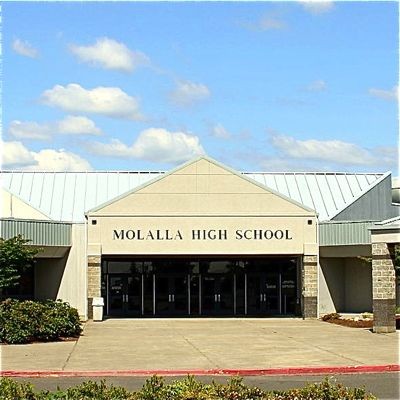
#40
Molalla High
Clackamas County
Enrollment: 739
Economically disadvantaged: 38%
Met or exceeded reading standards: 86.7%
Met or exceeded math standards: 73.5%
Met or exceeded writing standards: 49.1%
Met or exceeded science standards: 63.4%
Four year graduation rate: 75.2%
Photo Credit: Tedder - Own work. Licensed under CC BY 3.0 via Wikimedia Commons.

Prev
Next
#39
Reynolds High
Multnomah County
Enrollment: 2468
Economically disadvantaged: 65%
Met or exceeded reading standards: 84.6%
Met or exceeded math standards: 67.5%
Met or exceeded writing standards: 43.5%
Met or exceeded science standards: 58.9%
Four year graduation rate: 62.7%
Photo Credit:

Prev
Next
#38
Milwaukie High
Clackamas County
Enrollment: 1053
Economically disadvantaged: 57%
Met or exceeded reading standards: 77.1%
Met or exceeded math standards: 64.2%
Met or exceeded writing standards: 51.2%
Met or exceeded science standards: 67.8%
Four year graduation rate: 70.9%
Photo Credit: Pingveno - Own work. Licensed under CC BY 3.0 via Wikimedia Commons.

Prev
Next
#37
Centennial High
Multnomah County
Enrollment: 1665
Economically disadvantaged: 57%
Met or exceeded reading standards: 86.6%
Met or exceeded math standards: 78.9%
Met or exceeded writing standards: 62.7%
Met or exceeded science standards: 42.3%
Four year graduation rate: 78.7%
Photo Credit: naosuke ii via Compfight cc
Prev
Next
#36
Gresham High
Multnomah County
Enrollment: 1667
Economically disadvantaged: 52%
Met or exceeded reading standards: 83.9%
Met or exceeded math standards: 67.4%
Met or exceeded writing standards: 58.7%
Met or exceeded science standards: 59.7%
Four year graduation rate: 72.5%
Photo Credit: M.O. Stevens - Own work. Licensed under CC BY-SA 3.0 via Wikimedia Commons.
Prev
Next
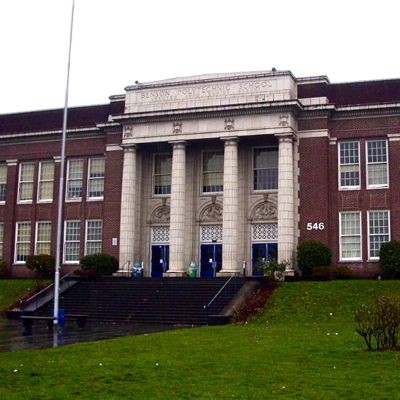
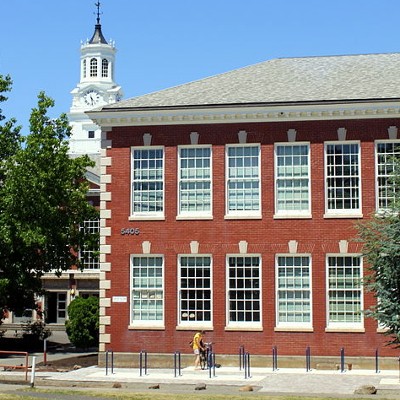
#35
Benson Polytechnic High
Multnomah County
Enrollment: 819
Economically disadvantaged: 68%
Met or exceeded reading standards: 87.1%
Met or exceeded math standards: 75.9%
Met or exceeded writing standards: 40.8%
Met or exceeded science standards: 84%
Four year graduation rate: 82.2%
Photo Credit: EncMstr - Own work. Licensed under CC BY-SA 3.0 via Wikimedia Commons.
Prev
Next
#34
Liberty High
Washington County
Enrollment: 1386
Economically disadvantaged: 46%
Met or exceeded reading standards: 89.8%
Met or exceeded math standards: 76%
Met or exceeded writing standards: 53.3%
Met or exceeded science standards: 65.8%
Four year graduation rate: 79.6%
Photo Credit: Aboutmovies

Prev
Next
#33
Aloha High
Washington County
Enrollment: 1962
Economically disadvantaged: 61%
Met or exceeded reading standards: 82.7%
Met or exceeded math standards: 64.5%
Met or exceeded writing standards: 62.2%
Met or exceeded science standards: 60.2%
Four year graduation rate: 72.2%

Prev
Next
#32
Sandy High
Clackamas County
Enrollment: 1286
Economically disadvantaged: 36%
Met or exceeded reading standards: 86.4%
Met or exceeded math standards: 69%
Met or exceeded writing standards: 59%
Met or exceeded science standards: 71.6%
Four year graduation rate: 76%
Prev
Next
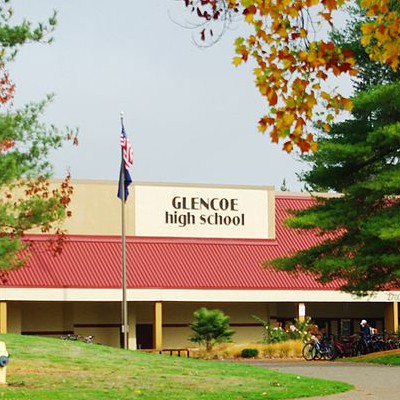
#31
Glencoe High
Washington County
Enrollment: 1601
Economically disadvantaged: 39%
Met or exceeded reading standards: 88.3%
Met or exceeded math standards: 70.5%
Met or exceeded writing standards: 58.4%
Met or exceeded science standards: 69.9%
Four year graduation rate: 77.1%

Prev
Next
#30
Banks High
Washington County
Enrollment: 384
Economically disadvantaged: 23%
Met or exceeded reading standards: 91.5%
Met or exceeded math standards: 79.8%
Met or exceeded writing standards: 57.4%
Met or exceeded science standards: 81.1%
Four year graduation rate: 80.6%
Photo Credit: frankjuarez via Compfight cc

Prev
Next
#29
Clackamas Middle College
Clackamas County
Enrollment: 290
Economically disadvantaged: 28%
Met or exceeded reading standards: 91.4%
Met or exceeded math standards: 76.3%
Met or exceeded writing standards: 59.3%
Met or exceeded science standards: 78%
Four year graduation rate: 32.6%
Photo Credit: Photo Credit: Maya83 via Compfight cc

Prev
Next
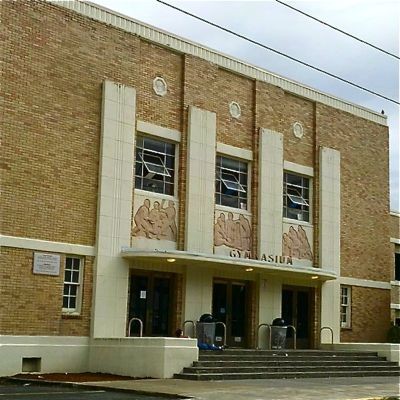
#28
Estacada High
Clackamas County
Enrollment: 589
Economically disadvantaged: 46%
Met or exceeded reading standards: 89.9%
Met or exceeded math standards: 77.7%
Met or exceeded writing standards: 59%
Met or exceeded science standards: 66.4%
Four year graduation rate: 71.8%

Prev
Next
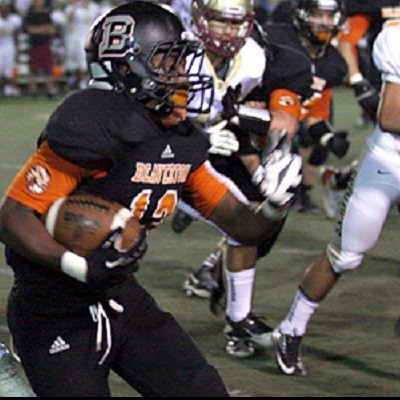
#27
Putnam High
Clackamas County
Enrollment: 1196
Economically disadvantaged: 39%
Met or exceeded reading standards: 88.6%
Met or exceeded math standards: 73.4%
Met or exceeded writing standards: 69.9%
Met or exceeded science standards: 59.3%
Four year graduation rate: 75.7%
Prev
Next
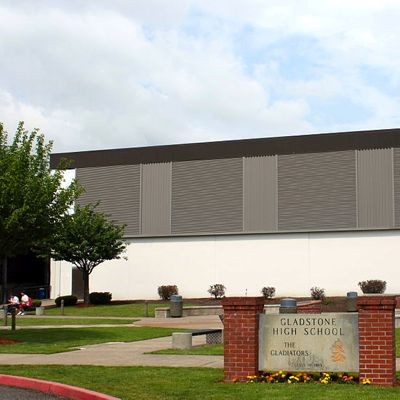
#26
Gladstone High
Clackamas County
Enrollment: 677
Economically disadvantaged: 40%
Met or exceeded reading standards: 88.7%
Met or exceeded math standards: 77.5%
Met or exceeded writing standards: 66%
Met or exceeded science standards: 82.2%
Four year graduation rate: 78.9%
Prev
Next
#25
Franklin High
Multnomah County
Enrollment: 1387
Economically disadvantaged: 56%
Met or exceeded reading standards: 89.2%
Met or exceeded math standards: 77.7%
Met or exceeded writing standards: 68.1%
Met or exceeded science standards: 59.8%
Four year graduation rate: 78.4%
_400_400_90.JPG)
Prev
Next
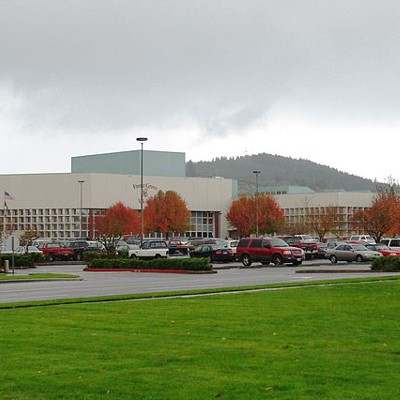
#24
Century High School
Washington County
Enrollment: 1608
Economically disadvantaged: 43%
Met or exceeded reading standards: 87.8%
Met or exceeded math standards: 78.6%
Met or exceeded writing standards: 62.7%
Met or exceeded science standards: 72.9%
Four year graduation rate: 84.8%
Prev
Next
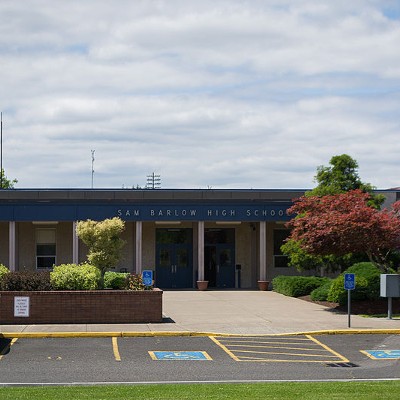
#23
Sam Barlow High School
Multnomah County
Enrollment: 1651
Economically disadvantaged: 38%
Met or exceeded reading standards: 84.5%
Met or exceeded math standards: 78.4%
Met or exceeded writing standards: 68.8%
Met or exceeded science standards: 76.7%
Four year graduation rate: 81.8%
Prev
Next
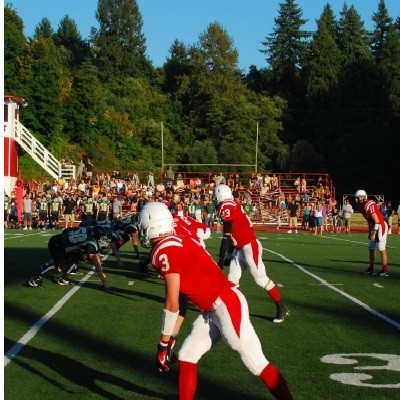
#22
Forest Grove High School
Washington County
Enrollment: 1779
Economically disadvantaged: 59%
Met or exceeded reading standards: 89.4%
Met or exceeded math standards: 85.7%
Met or exceeded writing standards: 66.6%
Met or exceeded science standards: 61.1%
Four year graduation rate: 72.5%

Prev
Next
#21
Canby High
Clackamas County
Enrollment: 1481
Economically disadvantaged: 32%
Met or exceeded reading standards: 87.3%
Met or exceeded math standards: 84%
Met or exceeded writing standards: 71.5%
Met or exceeded science standards: 61.6%
Four year graduation rate: 82.5%
Prev
Next
#20
Oregon City Senior High
Clackamas County
Enrollment: 2117
Economically disadvantaged: 34%
Met or exceeded reading standards: 97.5%
Met or exceeded math standards: 90.8%
Met or exceeded writing standards: 63%
Met or exceeded science standards: 76.7%
Four year graduation rate: 83%
Prev
Next
#19
Beaverton High
Washington County
Enrollment: 1588
Economically disadvantaged: 43%
Met or exceeded reading standards: 90%
Met or exceeded math standards: 76.7%
Met or exceeded writing standards: 70.7%
Met or exceeded science standards: 65.4%
Four year graduation rate: 74.2%
Prev
Next
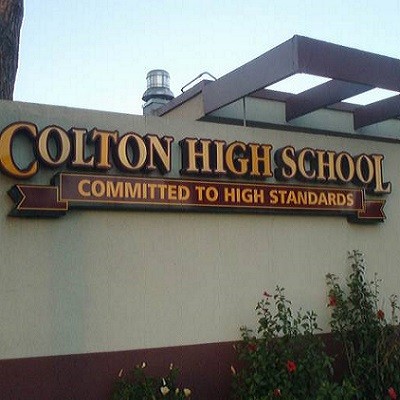
#18
Colton High
Clackamas County
Enrollment: 215
Economically disadvantaged: 28%
Met or exceeded reading standards: 90%
Met or exceeded math standards: 76%
Met or exceeded writing standards: 68%
Met or exceeded science standards: 85.1%
Four year graduation rate: 95.2%

Prev
Next
#17
Tualatin High
Washington County
Enrollment: 1714
Economically disadvantaged: 27%
Met or exceeded reading standards: 92.2%
Met or exceeded math standards: 76.7%
Met or exceeded writing standards: 62.9%
Met or exceeded science standards: 71.4%
Four year graduation rate: 84.4%

Prev
Next
#16
Tigard High
Washington County
Enrollment: 1835
Economically disadvantaged: 32%
Met or exceeded reading standards: 92.7%
Met or exceeded math standards: 83.5%
Met or exceeded writing standards: 64.5%
Met or exceeded science standards: 67.7%
Four year graduation rate: 80.8%
Photo Credit: Aboutmovies - Own work. Licensed under Public domain via Wikimedia Commons.
Prev
Next
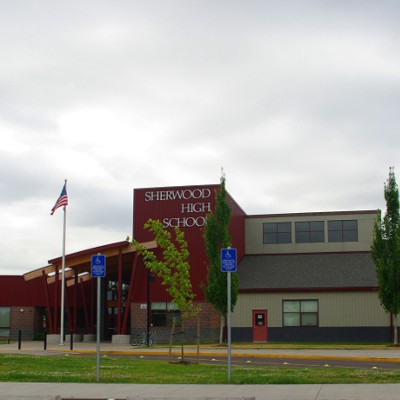
#15
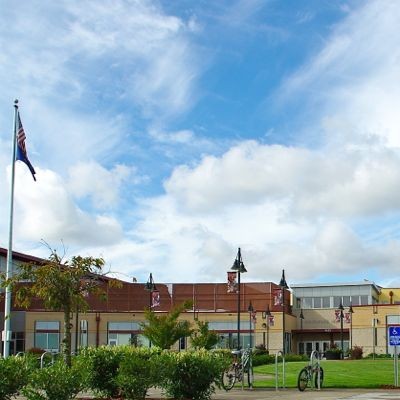
Sherwood High
Washington County
Enrollment: 1469
Economically disadvantaged: 15%
Met or exceeded reading standards: 97.5%
Met or exceeded math standards: 85.8%
Met or exceeded writing standards: 62.2%
Met or exceeded science standards: 84.8%
Four year graduation rate: 91.3%
Prev
Next
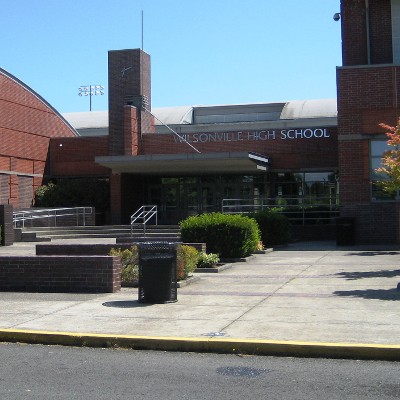
#14.
Wilsonville High
Clackamas County
Enrollment: 1093
Economically disadvantaged: 24%
Met or exceeded reading standards: 92.5%
Met or exceeded math standards: 74.1%
Met or exceeded writing standards: 74.2%
Met or exceeded science standards: 71.3%
Four year graduation rate: 85%
_399_400_90.JPG)
Prev
Next
#13
Clackamas High
Clackamas County
Enrollment: 2230
Economically disadvantaged: 29%
Met or exceeded reading standards: 91.7%
Met or exceeded math standards: 85.7%
Met or exceeded writing standards: 80.5%
Met or exceeded science standards: 74.2%
Four year graduation rate: 85.5%
Prev
Next
#12
Southridge High
Washington County
Enrollment: 1722
Economically disadvantaged: 27%
Met or exceeded reading standards: 91.5%
Met or exceeded math standards: 80.4%
Met or exceeded writing standards: 66.3%
Met or exceeded science standards: 68.9%
Four year graduation rate: 88.5%

Prev
Next
#11
Grant High
Multnomah County
Enrollment: 1489
Economically disadvantaged: 24%
Met or exceeded reading standards: 92.6%
Met or exceeded math standards: 83.3%
Met or exceeded writing standards: 70.3%
Met or exceeded science standards: 66.4%
Four year graduation rate: 84.3%
Prev
Next
#10
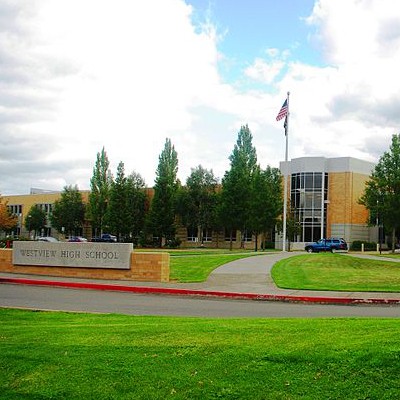
Westview High
Washington County
Enrollment: 2418
Economically disadvantaged: 33%
Met or exceeded reading standards: 92.2%
Met or exceeded math standards: 81.8%
Met or exceeded writing standards: 75.4%
Met or exceeded science standards: 70.3%
Four year graduation rate: 80.1%
Prev
Next
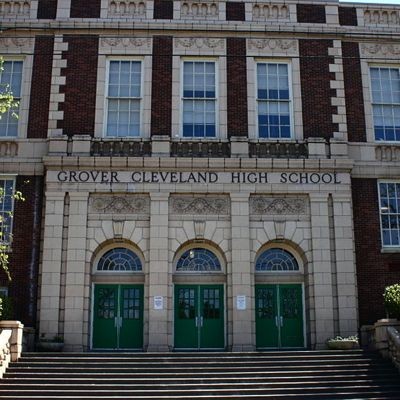
#9
Cleveland High
Multnomah County
Enrollment: 1457
Economically disadvantaged: 29%
Met or exceeded reading standards: 92.6%
Met or exceeded math standards: 80.2%
Met or exceeded writing standards: 81.4%
Met or exceeded science standards: 59.7%
Four year graduation rate: 76.2%
Photo Credit: Tedder - Own work. Licensed under CC BY 3.0 via Wikimedia Commons.

Prev
Next
#8
Sunset High
Washington County
Enrollment: 1942
Economically disadvantaged: 29%
Met or exceeded reading standards: 94.7%
Met or exceeded math standards: 83.3%
Met or exceeded writing standards: 76.8%
Met or exceeded science standards: 79.7%
Four year graduation rate: 81.4%

Prev
Next
#7
Wilson High
Multnomah County
Enrollment: 1185
Economically disadvantaged: 22%
Met or exceeded reading standards: 91.8%
Met or exceeded math standards: 80.4%
Met or exceeded writing standards: 82.8%
Met or exceeded science standards: 63.8%
Four year graduation rate: 84.4%
Prev
Next
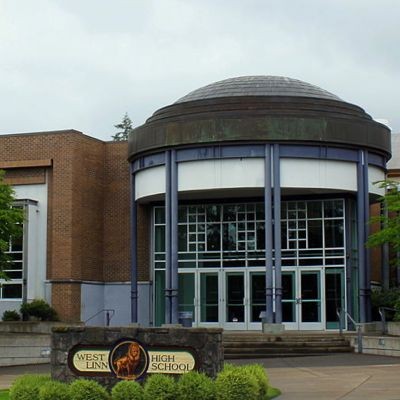
#6.
West Linn High
Clackamas County
Enrollment: 1514
Economically disadvantaged: 10%
Met or exceeded reading standards: 97.5%
Met or exceeded math standards: 87.9%
Met or exceeded writing standards: 85.8%
Met or exceeded science standards: 83.2%
Four year graduation rate: 93.2%

Prev
Next
#5
Riverdale High
Multnomah County
Enrollment: 242
Economically disadvantaged: <6%*
Met or exceeded reading standards: 97.5%
Met or exceeded math standards: 89.8%
Met or exceeded writing standards: 74.6%
Met or exceeded science standards: 74.6%
Four year graduation rate: 94.2%
* For less than six percent an asterisk is used on Oregon Department of Education data.

Prev
Next
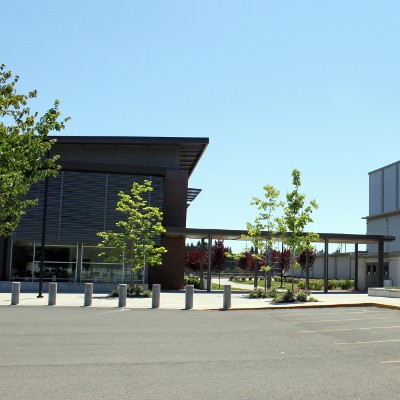
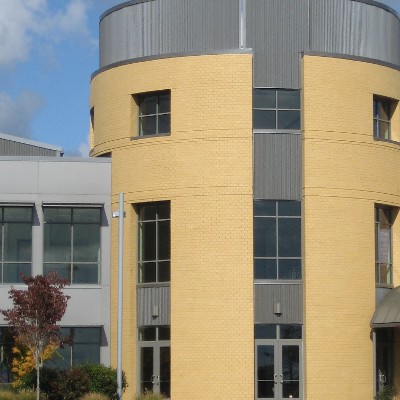
#4
School of Science & Technology
Washington County
Enrollment: 167
Economically disadvantaged: 20%
Met or exceeded reading standards: 97.5%
Met or exceeded math standards: 97.5%
Met or exceeded writing standards: 86%
Met or exceeded science standards: 63.9%
Four year graduation rate: 81.1%
Photo Credit: crazytales562 via Compfightcc
Prev
Next
#3
Lincoln High
Multnomah County
Enrollment: 1471
Economically disadvantaged: 12%
Met or exceeded reading standards: 92.5%
Met or exceeded math standards: 85.3%
Met or exceeded writing standards: 88.1%
Met or exceeded science standards: 79.9%
Four year graduation rate: 89.3%
Prev
Next
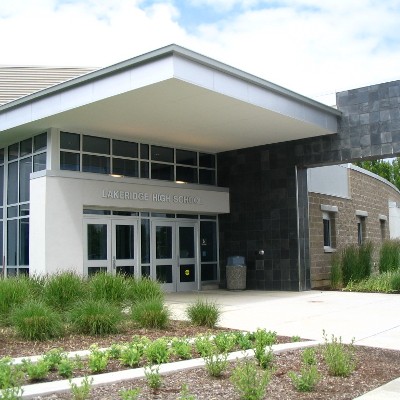
#2
Lakeridge High
Clackamas County
Enrollment: 1078
Economically disadvantaged: 8%
Met or exceeded reading standards: 97.5%
Met or exceeded math standards: 93.9%
Met or exceeded writing standards: 91.8%
Met or exceeded science standards: 92.1%
Four year graduation rate: 89.9%

Prev
Next
#1
Lake Oswego Senior High
Clackamas County
Enrollment: 1224
Economically disadvantaged: 6%
Met or exceeded reading standards: 97.5%
Met or exceeded math standards: 92.4%
Met or exceeded writing standards: 89.1%
Met or exceeded science standards: 87.7%
Four year graduation rate: 89.5%
Photo Credit: KristinNador via Compfight cc
Enjoy this post? Share it with others.
Email to a friend
Permalink


_80_80_90_c1.JPG)


_80_80_90_c1.JPG)


Follow us on Pinterest Google + Facebook Twitter See It Read It