Portland is the Whitest U.S. City - Why Demographics are Rapidly Shifting


Tuesday, July 14, 2015
It doesn’t really, but to start with, according to Charles Rynerson, a Portland State University demographer, the numbers on Portland’s white residents are accurate. “It’s true that among the 50 biggest cities in 1990, 2000 and 2010, Portland has been the whitest city in America,” he said.
In 2010, 76.2 percent of the population checked “white” on the census survey, while 71.4 percent marked white alone and not Hispanic or Latino.
But Rynerson explained, “The main thing that causes us to rank highest is how small our black population is. Our Latino and Asian population aren’t that small relative to the 50 biggest cities, but most of the big cities in the U.S. have large black populations and in most cases they’re concentrated in the central city.”
Another nuance: Portland doesn’t have the whitest metropolitan area in the U.S. Pittsburgh, Penn., does. The Portland metro area is seventh whitest. “A lot of Latinos or Asians are more recent immigrants so they settled more in suburban areas,” said Rynerson.
There are a handful of cities in the Midwest or Northeast that don’t have big Asian or Latino populations, so therefore they have much whiter suburbs than Portland does while having a larger black population in the central city, explained Rynerson.
It’s worth noting that the white population in the Portland-Vancouver-Hillsboro statistical area was still pretty high—76.3 percent of people identify as white alone—higher than the city of Portland. But certain pockets of the area have higher non-white populations, such as Washington County, which has 15.7 percent Latinos of any race, 10.6 percent Asians and 8.4 percent identifying as something other than is listed on the Census.
But if we’re talking about numbers, demographic stats just show how unequal the experience of being Black or Latino in Oregon is from being white. According to the American Civil Liberties Union’s 2013 legislative report card on racial equity in Oregon, 15 percent of whites were in poverty, 30 percent of Latinos, 34 percent of Native Americans, 36 percent of Hawaiian/Pacific Islanders and 41 percent of African Americans.
The report notes how Oregon’s demographics are changing and what that means for equity:
“The changing population and stark disparities demand that we pay attention to how we are making decisions. The policy and budget decisions that we make today can either increase opportunity and improve outcomes across race, gender and class lines or worsen disparities.”
Population is, in fact, changing—especially for the rest of the state, which Rynerson said is becoming more “non-white” at a faster rate than the city of Portland. The bulk of that comes from Latino and Hispanic populations that are represented in small towns and rural areas.
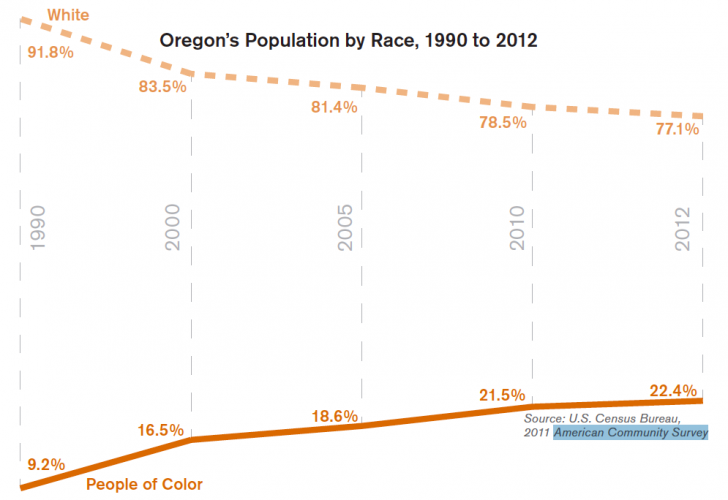
Oregon's population by race, 1990 - 2012
At 11.7 percent of the population statewide, Latinos are actually a bigger part of the population outside of Multnomah County, which has 10.9 percent Latinos. Some counties are particularly high, such as Umatilla with 23.9 percent, Marion County with 24.3 percent, Hood River County with 29.5 percent, Morrow County with 31.3 percent and Malheur County with 31.5 percent.
And Rynerson said the Latino population will continue to grow and has since 2010’s census. “Mostly it has to do with age structure of the population,” he said.
The Latino population in Multnomah County is relatively young spiking for people under 18 years of age tapering a little bit and then spiking again for 25 to 44 year olds. Put another way, 55.9 percent of children in Portland under 18 were white in 2010. For those 65 and older, 83.9 percent were white.
“The diversity comes from people moving in but also from what demographers call ‘natural increase’—the birth rate minus death rate,” said Rynerson. “Even without new people moving in, the population would continue to get more diverse through natural increase.”
This trend is echoed when you look at school enrollment, where the Hispanic/Latino population has only been increasing. In Portland Public Schools, 15.7 percent of students are Latino, according to the Oregon Department of Education’s enrollment figures for 2014-2015. Only 56.8 percent of PPS students are white.
The Latino population is even higher in Parkrose and David Douglas school districts, with 26.7 percent and 24.6 percent respectively. And both also have higher percentages of other races: In Parkrose, 16.7 percent are Asian and 13.4 are black, while 34.4 percent are white. In David Douglas, 15.9 percent of students are Asian, 10.1 percent are black and 42 percent are white.
Though the Latino birthrate has actually dropped slightly since the recession, as it did for all births in the U.S., Rynerson said Hispanics/Latinos still accounted for 19 percent of all births in Oregon, suggesting that Oregon is no exception: The Latino population will continue to make up a larger percentage of the state’s ethnic makeup.
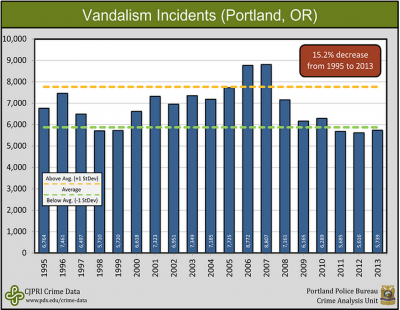
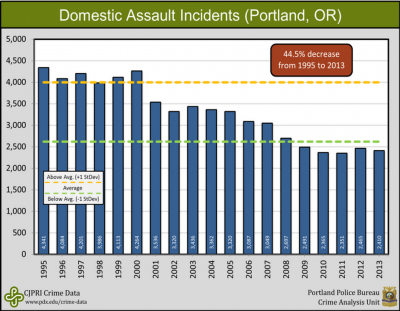
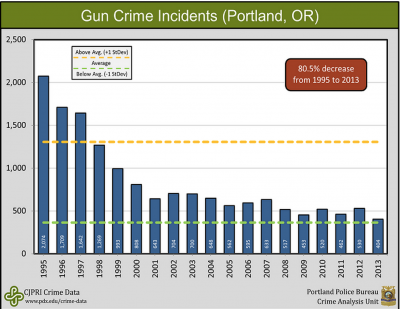
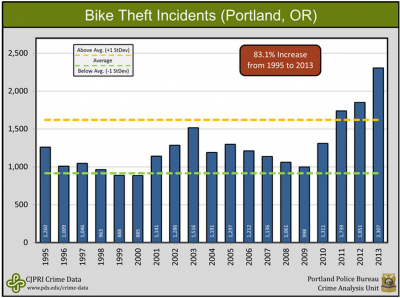
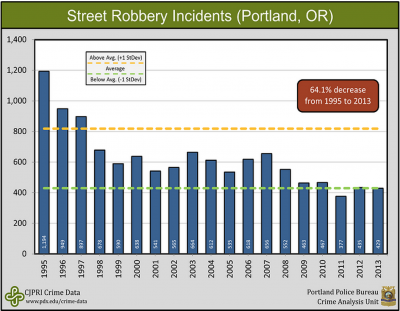
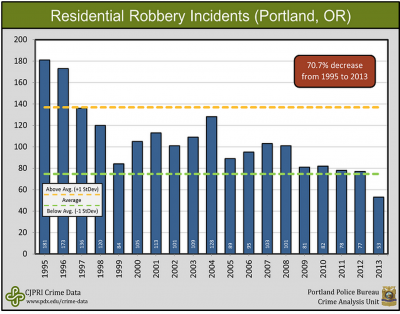
Related Slideshow: Crime Trends in Portland - Good News and Bad News
The Portland Police Bureau's Strategic Services Division and the Criminology and Criminal Justice program at Portland State University (PSU) have partnered to provide an interactive tool to provide a longer term look at crime trends.
The interactive data shows the geographic distribution of crime in the city; and reveals insights into crime data.
See key findings below.


Related Articles
- Portland’s Charter Schools Whiter Than Its Public Schools
- Will Pot Legalization Fix Racial Disparity in Marijuana Arrests?
- How Portland Schools Dropped the Ball on Effective Racial Justice Practices


Follow us on Pinterest Google + Facebook Twitter See It Read It