Oregon Counties with the Most Poverty


 Email to a friend
Permalink
Email to a friend
Permalink
Thursday, June 04, 2015
Kirsten Nicolaisen, GoLocalPDX Content Manager
In the U.S., 48 million Americans
live below the poverty line. Some states have tried to combat this problem by
pushing to increase the minimum wage. Across Oregon 1 in 6 people are living in poverty, but certain parts of Oregon are more affected than others.
Malheur County is more poverty-stricken than any other party of Oregon, with 25% of the population living below the poverty line (as of 2010). Malheur is followed closely by Sherman County at 22.4% and Benton County at 21.6%.
In Multnomah County, 17.1% of the population is living below the poverty line, but it's surrounding counties- Washington, Clackamas and Hood River- have the fewest people living below the poverty line in the state.
In order to see how poverty in Oregon has changed over time , genealogy data site MooseRoots analyzed Oregon's poverty levels in each county from 1980 to 2010. Since 1980, the poverty threshold has been updated annually to reflect changing costs of living according to the Consumer Price Index (CPI). The current poverty threshold for a family of four is $24,250 a year.
Poverty has risen in every Oregon county except Wheeler and Hood River since 1980. Harney County in Southeastern Oregon has seen a 10% rise in poverty since 1980- the greatest increase in the state. Wasco, Benton and Sherman counties also saw close to 10% increases in poverty levels.
In Portland alone, more than 10 neighborhoods doubled or quickly increased their poverty rates in the last 40 years, according to a report by City Observatory. Five neighborhoods had poverty rates grow from under 15% in 1970 to over 30% by 2010.
See the interactive graphs below for poverty levels and increases from 1980-2010 in each Oregon county.
Oregon | MooseRoots
Places | MooseRoots
MooseRoots | FindTheHome
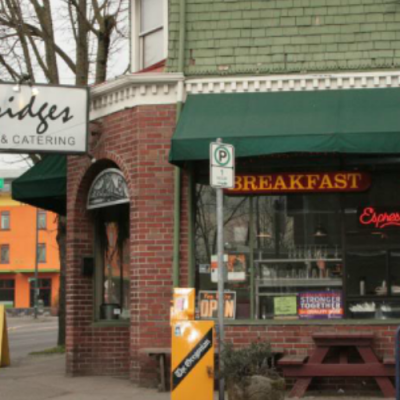
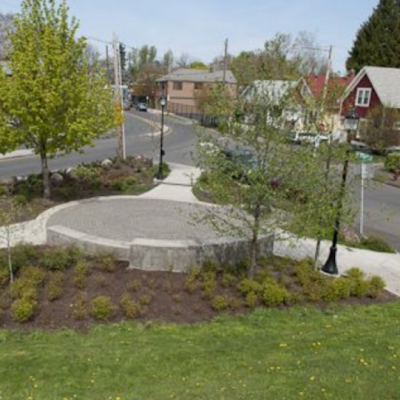
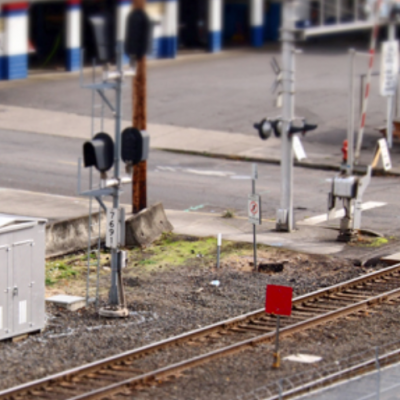
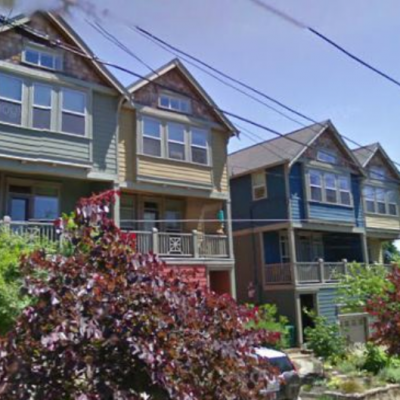
Related Slideshow: 15 Portland Area Neighborhoods With Fastest Growing Poverty
A report from the City Observatory revealed the increasing poverty rates in the Portland metro-area for census tracks. Find which areas saw the highest increases in poverty.
Prev
Next
#15
Eliot
Poverty rate in 1970: 38 percent
Poverty rate in 2010: 34 percent
Decrease in poverty rate: 4 percent
Prev
Next
#14
Humboldt
Poverty rate in 1970: 32 percent
Poverty rate in 2010: 34 percent
Increase in poverty rate: 2 percent
Prev
Next
#13
Buckman
Poverty rate in 1970: 29 percent
Poverty rate in 2010: 32 percent
Increase in poverty rate: 3 percent

Prev
Next
#12
West Portsmouth
Poverty rate in 1970: 25 percent
Poverty rate in 2010: 30 percent
Increase in poverty rate: 5 percent
Prev
Next
#11
North King
Poverty rate in 1970: 19 percent
Poverty rate in 2010: 31 percent
Increase in poverty rate: 12 percent
Prev
Next
#10
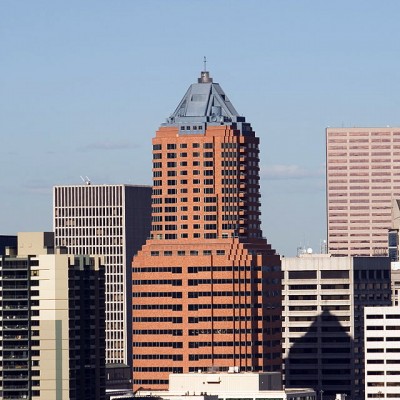
South Downtown
Poverty rate in 1970: 25 percent
Poverty rate in 2010: 39 percent
Increase in poverty rate: 14 percent
Prev
Next
#9
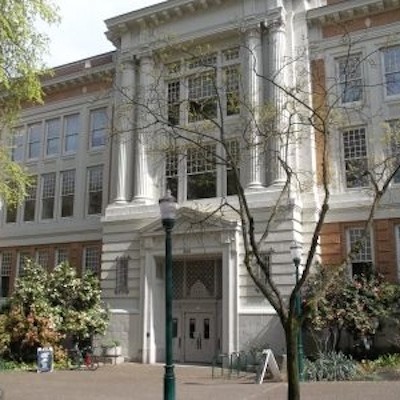
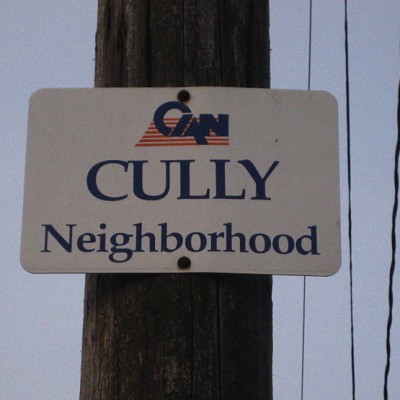
East Cully & North Roseway
Poverty rate in 1970: 15 percent
Poverty rate in 2010: 31 percent
Increase in poverty rate: 16 percent
Prev
Next
#8
North Downtown
Poverty rate in 1970: 36 percent
Poverty rate in 2010: 52 percent
Increase in poverty rate: 16 percent
Prev
Next
#7
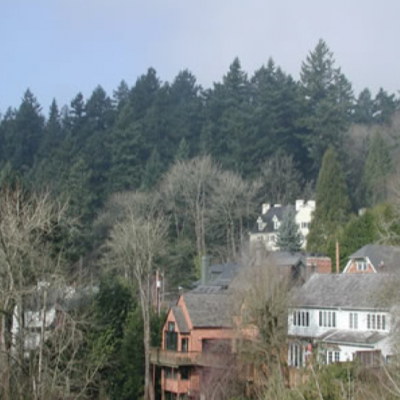
Goose Hollow
Poverty rate in 1970: 21 percent
Poverty rate in 2010: 40 percent
Increase in poverty rate: 19 percent
Prev
Next
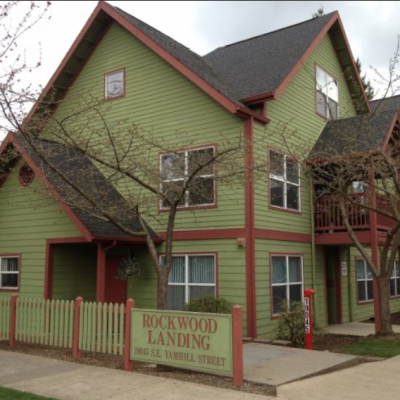
#6
Rockwood & North Centennial in Gresham
Poverty rate in 1970: 10 percent
Poverty rate in 2010: 30 percent
Increase in poverty rate: 20 percent
Prev
Next
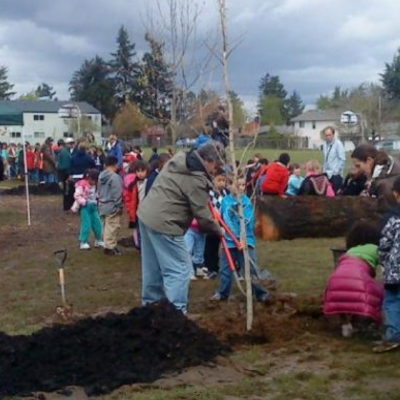
#5
University Park
Poverty rate in 1970: 10 percent
Poverty rate in 2010: 32 percent
Increase in poverty rate: 22 percent
Prev
Next
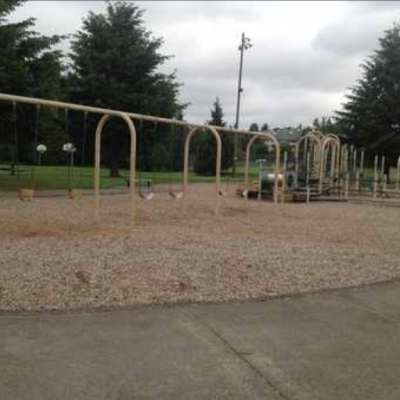
#4
Central Powelhurst-Gilbert
Poverty rate in 1970: 11 percent
Poverty rate in 2010: 35 percent
Increase in poverty rate: 24 percent
Prev
Next
#3
Maple Wood, Bagley Downs Neighborhood & Meadow Homes Neighborhood in Vancouver
Poverty rate in 1970: 5 percent
Poverty rate in 2010: 31 percent
Increase in poverty rate: 26 percent
Prev
Next
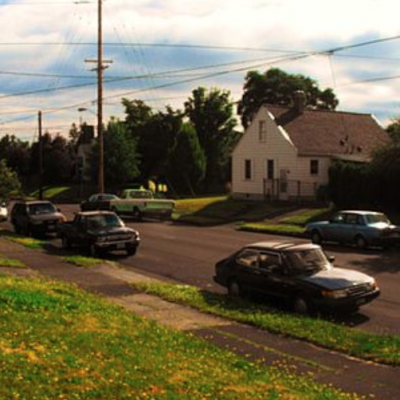
#2
Glenfair & South Wilkes
Poverty rate in 1970: 5 percent
Poverty rate in 2010: 34 percent
Increase in poverty rate: 29 percent
Prev
Next
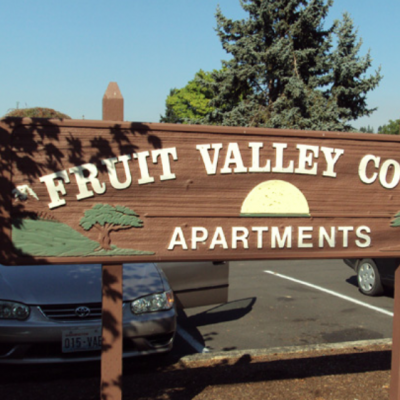
#1
Fruit Valley in Vancouver
Poverty rate in 1970: 5 percent
Poverty rate in 2010: 36 percent
Increase in poverty rate: 31 percent
Related Articles
Enjoy this post? Share it with others.
Email to a friend
Permalink


Follow us on Pinterest Google + Facebook Twitter See It Read It