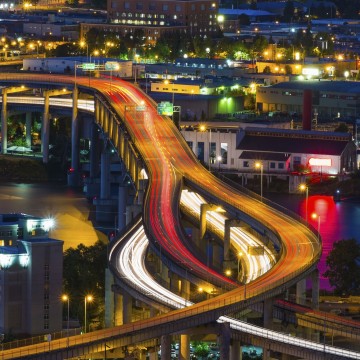
Oregon Could Lose $1 Billion a Year Because of Traffic Congestion


Tuesday, January 06, 2015
The study was commissioned by 33 businesses that operate in the Portland-area.
“If that’s your future, then that seems kind of sad, and that’s not very attractive to me,” said Susie Lahsene, senior manager of transportation and land use policy at Port of Portland.
The average Portland metro household will experience 69 hours of road congestion this year. A total of 5 percent of all Portland metro area travel time is spent under congested conditions, like stop-and-go traffic, according to the study.
Lahsene said that equates to two work-weeks.
The amount of travel-in-traffic in Portland is expected to triple by the year 2040, to an average of 210 hours per household annually, Lahsene said.
“This is a national phenomena that we’re not escaping here,” said Marion Haynes, vice president of government affairs at the Portland Business Alliance. “It’s truly an investment in the system, investment in jobs, investment in the economy of the future.”
Traffic congestion is expected to increase more for trucks and freight companies than it will for individual drivers. However, this is bad for businesses, Haynes said. Oregon’s transportation system carried approximately $300 billion worth of goods in 2012 - significantly more than the GDP of the entire state - $205 million.
The report stated that 72 percent of the $300 billion flowing through the state - $215 billion of it - was carried by truck.
That can mean increased costs for companies. If a business is unsure about travel times, it’s forced to use contingencies, according to Haynes.
“In some cases were talking to businesses that are shipping out a product that goes into another production cycle, to make something else,” Haynes said. “When you miss a delivery it has ripple effects. You need to know that a product will be where it needs to be at the time it needs to be there.”
With Portland area ranking fifth in exports among western metropolitan areas, Oregon is an extremely trade-dependent state, Lahsense said.
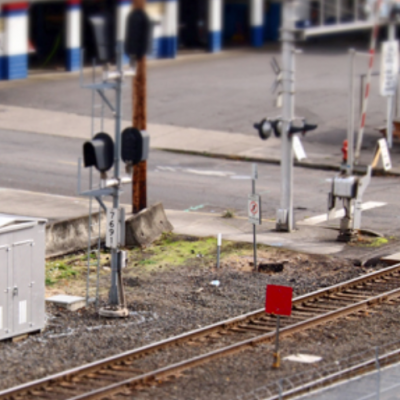
Exports rely on a transportation system and the ‘linkages’ to that system, like rail hubs or airports, according to the report.
“When that part of the system isn’t performing, then you obviously make yourself less competitive,” Lahsene said. “Businesses have to find a new locations, they have to find new gateways, and there’s obviously a cost to that.”
Haynes agreed that ensuring adequate linkage to transportation systems in the metro area are critical for businesses throughout the state.
A lot of transportation challenges are in the Metro area because most of the state’s commerce must flow through it in one way or another, Lehsene said.
Ten years ago, businesses began delivery operations at 5 a.m. to avoid traffic.
“It’s no longer enough,” Haynes said. “Businesses are starting shifts at 2 o'clock in morning now.”
In Oregon, 90 percent of exporters are small businesses, according to the Port of Portland.
Infrastructure Investment
The state would have to spend $24 billion to fully address the problem, according to Lahsene.
Every $1 invested in transportation could pay off as $2.30 by 2040, the report also stated.
Some of the funds from the $24 billion recommended by the Port of of Portland is already here - the state legislature approved a $8 billion in investments into infrastructure in 2009.
“There’s still a lot more work to do,” Lahsene said.
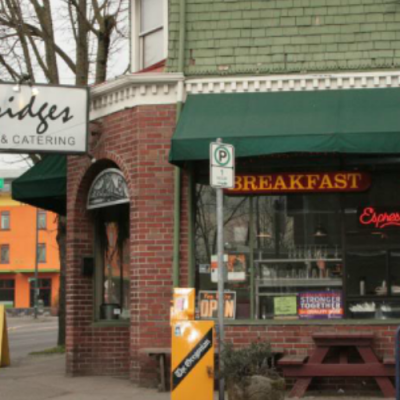
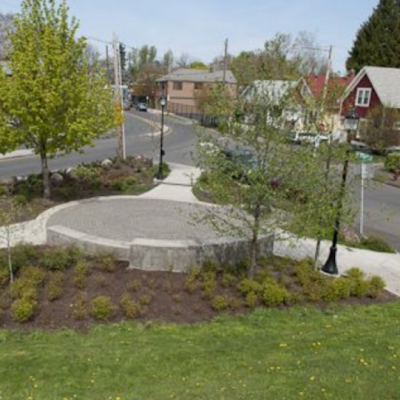
Related Slideshow: 15 Portland Area Neighborhoods With Fastest Growing Poverty
A report from the City Observatory revealed the increasing poverty rates in the Portland metro-area for census tracks. Find which areas saw the highest increases in poverty.


Follow us on Pinterest Google + Facebook Twitter See It Read It