Is Oregon’s Poor Education Rankings Affecting Oregon Economy?


 Email to a friend
Permalink
Email to a friend
Permalink
Monday, August 03, 2015
Jack Rushall and GoLocalPDX News Team
Oregon’s schools are consistently being ranked among the worst in the United States. The most recent was last week’s ranking by WalletHub that scored Oregon is the 46th ranked in America. These poor rankings may be having both a short-term and a long-term impact on Oregon’s economy.
Education Week’s “Quality Counts 2015: Report And Rankings” state report card, ranked Oregon as #35 for public education in comparison with other states.
Only recently, Oregon has made a major investment in improving education, but the sides are split on whether the dollars being poured in will improve the system.
“Low rankings are having a negative impact on the economy,” said Mark Johnson, a Republican House representative from District 52. “Out-of-state companies and employees are looking to relocate their workforce where there’s a strong school system, where there are good schools for them to enroll their kids.”
Correspondingly, CEO Magazine ranks Oregon poorly for business. Oregon ranks 42nd overall and received a poor score for the quality of the workforce.
The most concerning of all the education measures is the disappointing ranking for Oregon in terms of high school dropout rates. According to the U.S. Department of Education data as reported by Governing magazine, Oregon is ranked 50th with a dropout rate of 68%, and it has held at that exact number for the past three years.
For low-income children, Oregon’s graduation rate is just 60% (49th ranked) and the most disturbing is the graduation rate for high school students with disabilities – the graduation rate is just 37% (47th ranked). The U.S. average high school graduation rate is 81%.
Indeed, having a reputation for possessing a poor public education system is a potential hindrance in attracting out of state business. Companies –and employees from out of state are likely to have families and are going to have their child’s academic livelihood in mind when relocating a business.
As Johnson noted, “The money isn’t getting to the students.”
Funding at the Bottom
For four years, 2010 thru 2013, education funding adjusted for inflation decreased by 8.7% according to Governing magazine.
This year, Oregon has increased funding for elementary and secondary schools, dramatically boosted the funding for colleges, and made community colleges free.
In the 2015 session, the Oregon Legislature boosted public college and university funding by 22%, with more money being poured into the public education sector than has been seen in two decades.
There was a specific emphasis on adding money to students enrolled in kindergarten through third grade, and also towards community colleges and public universities. Legislators believe that the key to later academic success is focusing on children during their early education.
Kristen Grainger, Communications Director for Governor Kate Brown, believes that the increase in public education funding was substantial and that its effects will be dramatic. “The recent historic investment in education by Gov. Brown and the Legislature makes important progress towards the creation of a seamless education continuum from birth to career; a system based on good public policies, informed by practice, that recognizes good teachers and cultivates teaching excellence at every school.”
However, certain members of the state Legislature are not convinced that the recent fiscal reforms are going to be as visibly executed as some, like Grainger, may assume. After all, where does all the money go?
“There was an increase – across the board," said Johnson. Still, Johnson is skeptical of where the money will be allotted. As a former board chairman on the Hood River County School board, Johnson has experience firsthand with overseeing the implementation of state funding in public school systems.
“Even though we added more money into the system,” Johnson said, “We haven’t put enough in to put a dent into the issue of large class size. Rollup costs are between 4 and 5 percent a year. 80% of your budget goes to personnel and faculty – their salary or a salary with benefits.”
Though Johnson admits that good teachers usually translate into better students, he also stresses that focusing on resources may be the key to a child’s academic success. To Johnson, the Legislature could be focusing on funding in a more productive manner.
“It all comes down to the budget making process. We need to reinvent how we budget education,” Johnson said. “It should be a collaborative effort to budget K-12, and the process needs to start with focusing on the resources.”
Related Slideshow: Top 100 Oregon High Schools
GoLocalPDX has ranked high schools across the state based on a method developed at Babson College, Mass. See below for the top 100 schools in the Beaver State.

Prev
Next
#100
South Albany High School
Greater Albany Public School District
Enrollment: 1260
Economically disadvantaged: 55%
Met or exceeded reading standards: 86.9%
Met or exceeded math standards: 65.5%
Met or exceeded writing standards: 68.1%
Met or exceeded science standards: 54.6%
Four year graduation rate: 76.2%
Photo Credit: kamera kızı via Compfight cc

Prev
Next
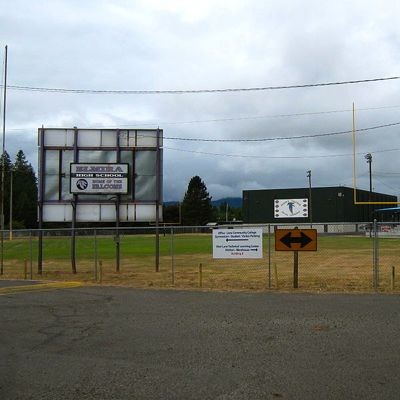
#99
Yamhill Carlton High
Yamhill Carlton School District
Enrollment: 375
Economically disadvantaged: 32%
Met or exceeded reading standards: 93.8%
Met or exceeded math standards: 60.8%
Met or exceeded writing standards: 47.9%
Met or exceeded science standards: 69.6%
Four year graduation rate: 83.8%

Prev
Next
#98
Phoenix High
Phoenix-Talent School District
Enrollment: 695
Economically disadvantaged: 54%
Met or exceeded reading standards: 88.3%
Met or exceeded math standards: 74.7%
Met or exceeded writing standards: 64%
Met or exceeded science standards: 56.4%
Four year graduation rate: 70.6%

Prev
Next
#97
Benson Polytechnic High
Portland School District
Enrollment: 819
Economically disadvantaged: 68%
Met or exceeded reading standards: 87.1%
Met or exceeded math standards: 75.9%
Met or exceeded writing standards: 40.8%
Met or exceeded science standards: 84%
Four year graduation rate: 82.2%
Prev
Next
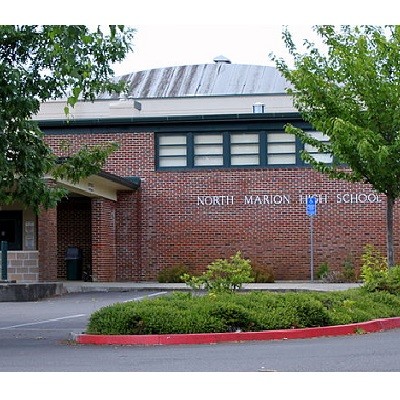
#96
North Marion High
North Marion School District
Enrollment: 588
Economically disadvantaged: 62%
Met or exceeded reading standards: 86.3%
Met or exceeded math standards: 64.9%
Met or exceeded writing standards: 58.6%
Met or exceeded science standards: 58.5%
Four year graduation rate: 87.6%

Prev
Next
#95
Hidden Valley High
Three Rivers/Josephine County School District
Enrollment: 681
Economically disadvantaged: 53%
Met or exceeded reading standards: 83.7%
Met or exceeded math standards: 71.4%
Met or exceeded writing standards: 52.2%
Met or exceeded science standards: 66.7%
Four year graduation rate: 68.3%
Photo Credit: dcJohn via Compfight cc
Photo Credit: sleepyneko via Compfight cc

Prev
Next
#94
North Valley High
Three Rivers/Josephine County School District
Enrollment: 522
Economically disadvantaged: 51%
Met or exceeded reading standards: 89.2
Met or exceeded math standards: 56%
Met or exceeded writing standards: 46.8%
Met or exceeded science standards: 72.2%
Four year graduation rate: 68.3%
Photo Credit: naosuke ii via Compfight cc
Photo Credit: peteoshea via Compfight cc

Prev
Next
#93
Stayton High
North Santiam School District
Enrollment: 749
Economically disadvantaged: 48%
Met or exceeded reading standards: 85.3%
Met or exceeded math standards: 68.9%
Met or exceeded writing standards: 56.8%
Met or exceeded science standards: 70.6%
Four year graduation rate: 70.1%
Photo Credit: katerha via Compfight cc
Prev
Next
#92
Liberty High
Hillsboro School District
Enrollment: 1386
Economically disadvantaged: 46%
Met or exceeded reading standards: 89.8%
Met or exceeded math standards: 76%
Met or exceeded writing standards: 53.3%
Met or exceeded science standards: 65.8%
Four year graduation rate: 79.6%
Photo Credit: Aboutmovies, CC

Prev
Next
#91
Academy of Arts and Academics
Springfield School District
Enrollment: 280
Economically disadvantaged: 49%
Met or exceeded reading standards: 90.7%
Met or exceeded math standards: 57.4%
Met or exceeded writing standards: 65.4%
Met or exceeded science standards: 73.6%
Four year graduation rate: 84.1%
Prev
Next
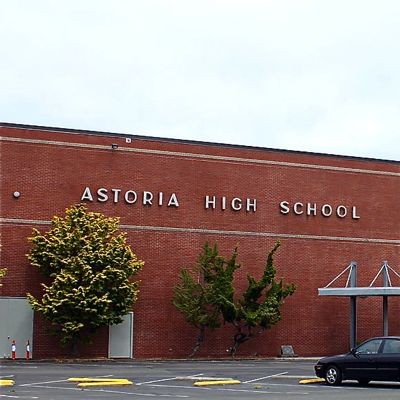
#90
Astoria Senior High
Astoria School District
Enrollment: 572
Economically disadvantaged: 48%
Met or exceeded reading standards: 93.1%
Met or exceeded math standards: 73.8%
Met or exceeded writing standards: 74.3%
Met or exceeded science standards: 52.7%
Four year graduation rate: 59.9%

Prev
Next
#89
Crane Union high School
Harney County Union High School District
Enrollment: 69
Economically disadvantaged: 39%
Met or exceeded reading standards: 97.5%
Met or exceeded math standards: 97.5%
Met or exceeded writing standards: 52.2%
Met or exceeded science standards: 69.6%
Four year graduation rate: 95%

Prev
Next
#88
Vale High
Vale School District
Enrollment: 234
Economically disadvantaged: 52%
Met or exceeded reading standards: 84.6%
Met or exceeded math standards: 64.6%
Met or exceeded writing standards: 63.1%
Met or exceeded science standards: 81.5%
Four year graduation rate: 88.2%

Prev
Next
#87
Gold Beach High
Central Curry School District
Enrollment: 173
Economically disadvantaged: 57%
Met or exceeded reading standards: 91.9%
Met or exceeded math standards: 81.1%
Met or exceeded writing standards: 62.2%
Met or exceeded science standards: 80.8%
Four year graduation rate: 56.7%
Photo Credit: Google
Prev
Next
#86
Dallas High
Dallas School District
Enrollment: 979
Economically disadvantaged: 35%
Met or exceeded reading standards: 84.4%
Met or exceeded math standards: 72.8%
Met or exceeded writing standards: 49%
Met or exceeded science standards: 69.8%
Four year graduation rate: 52.9%
Photo Credit: Tedder - Own work. Licensed under CC BY 3.0 via Wikimedia Commons.
Prev
Next
#85
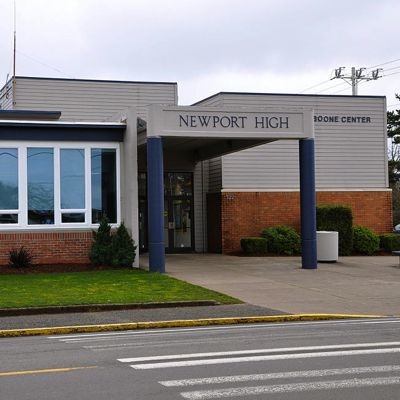
Newport High School
Lincoln County School District
Enrollment: 528
Economically disadvantaged: 43%
Met or exceeded reading standards: 91.7%
Met or exceeded math standards: 81.7%
Met or exceeded writing standards: 62.6%
Met or exceeded science standards: 57.8%
Four year graduation rate: 70.7%
Photo Credit: Finetooth - Own work. Licensed under CC BY-SA 3.0 via Wikimedia Commons.
Prev
Next
#84
LaPine Senior High
Bend-LaPine School District
Enrollment: 439
Economically disadvantaged: 63%
Met or exceeded reading standards: 88.9%
Met or exceeded math standards: 72.4%
Met or exceeded writing standards: 47.5%
Met or exceeded science standards: 62.2%
Four year graduation rate: 74.7%
Photo Credit: samantha celera via Compfight cc

Prev
Next
#83
Aloha High
Beaverton School District
Enrollment: 1962
Economically disadvantaged: 61%
Met or exceeded reading standards: 82.7%
Met or exceeded math standards: 64.5%
Met or exceeded writing standards: 62.2%
Met or exceeded science standards: 60.2%
Four year graduation rate: 72.7%

Prev
Next
#82
La Grande High
La Grande School District
Enrollment: 560
Economically disadvantaged: 37%
Met or exceeded reading standards: 84.3%
Met or exceeded math standards: 60%
Met or exceeded writing standards: 56.4%
Met or exceeded science standards: 59.4%
Four year graduation rate: 74.1%
Photo Credit: Fiorenza Thompson via Compfight cc
Prev
Next
#81
Yoncalla High
Yoncalla School District
Enrollment: 87
Economically disadvantaged: 70%
Met or exceeded reading standards: 97.5%
Met or exceeded math standards: 58.8%
Met or exceeded writing standards: 64.7%
Met or exceeded science standards: 52.9%
Four year graduation rate: 78.8%
Visitor7 - Own work. Licensed under CC BY-SA 3.0 via Wikimedia Commons.
Prev
Next
#80
Elmira High
Fern Ridge School District
Enrollment: 436
Economically disadvantaged: 52%
Met or exceeded reading standards: 88.7%
Met or exceeded math standards: 70.1%
Met or exceeded writing standards: 63.5%
Met or exceeded science standards: 66.7%
Four year graduation rate: 77.6%
Photo Credit: Katr67 - Own work. Licensed under Public domain via Wikimedia Commons.

Prev
Next
#79
Churchill High
Eugene School District
Enrollment: 1020
Economically disadvantaged: 44%
Met or exceeded reading standards: 82.5%
Met or exceeded math standards: 73.6%
Met or exceeded writing standards: 68.8%
Met or exceeded science standards: 61.3%
Four year graduation rate: 69.2%
Photo Credit: EvelynGiggles via Compfight cc
Prev
Next
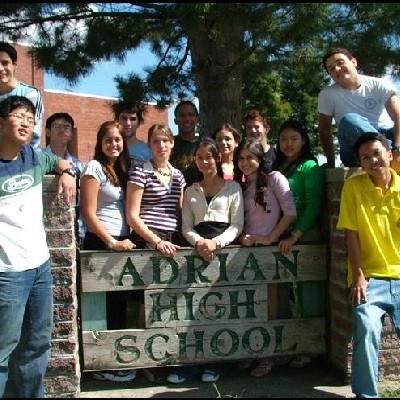
#78
Adrian High
Adrian School District
Enrollment: 64
Economically disadvantaged: 55%
Met or exceeded reading standards: 97.5%
Met or exceeded math standards: 57.1%
Met or exceeded writing standards: 71.4%
Met or exceeded science standards: 57.1%
Four year graduation rate: 95.5%
Prev
Next
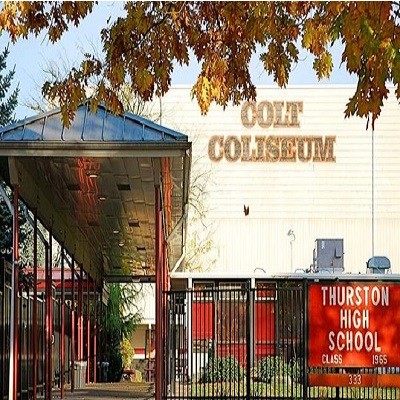
#77
Thurston High
Springfield School District
Enrollment: 1387
Economically disadvantaged: 42%
Met or exceeded reading standards: 85%
Met or exceeded math standards: 68.8%
Met or exceeded writing standards: 73.4%
Met or exceeded science standards: 57.6%
Four year graduation rate: 74.9%

Prev
Next
#76
North Medford High
Medford School District
Enrollment: 1612
Economically disadvantaged: 50%
Met or exceeded reading standards: 89.6%
Met or exceeded math standards: 74.6%
Met or exceeded writing standards: 55.1%
Met or exceeded science standards: 73.9%
Four year graduation rate: 68%
Photo Credit: theilr via Compfight cc
Prev
Next
#75
Klamath Union High
Klamath Falls City School District
Enrollment: 663
Economically disadvantaged: 56%
Met or exceeded reading standards: 81.9%
Met or exceeded math standards: 69.5%
Met or exceeded writing standards: 40.2%
Met or exceeded science standards: 54.8%
Four year graduation rate: 83.4%
Photo Credit: User:bobjgalindo - Own work. Licensed under CC BY-SA 3.0 via Wikimedia Commons.

Prev
Next
#74
Sandy High
Oregon Trail School District
Enrollment: 1286
Economically disadvantaged: 36%
Met or exceeded reading standards: 86.4%
Met or exceeded math standards: 69%
Met or exceeded writing standards: 59%
Met or exceeded science standards: 71.6%
Four year graduation rate: 76%

Prev
Next
#73
Henley High
Klamath County School District
Enrollment: 608
Economically disadvantaged: 33%
Met or exceeded reading standards: 86.7%
Met or exceeded math standards: 74.7%
Met or exceeded writing standards: 54.7%
Met or exceeded science standards: 64.7%
Four year graduation rate: 84.9%

Prev
Next
#72
Pendleton High
Pendleton School District
Enrollment: 881
Economically disadvantaged: 43%
Met or exceeded reading standards: 88.8%
Met or exceeded math standards: 82.7%
Met or exceeded writing standards: 49.7%
Met or exceeded science standards: 61.2%
Four year graduation rate: 75.5%

Prev
Next
#71
Cottage Grove High
South Lane School District
Enrollment: 761
Economically disadvantaged: 59%
Met or exceeded reading standards: 90.4%
Met or exceeded math standards: 70.9%
Met or exceeded writing standards: 54.6%
Met or exceeded science standards: 64%
Four year graduation rate: 87.6%
Photo Credit: Visitor7 - Own work. Licensed under CC BY-SA 3.0 via Wikimedia Commons.
Prev
Next
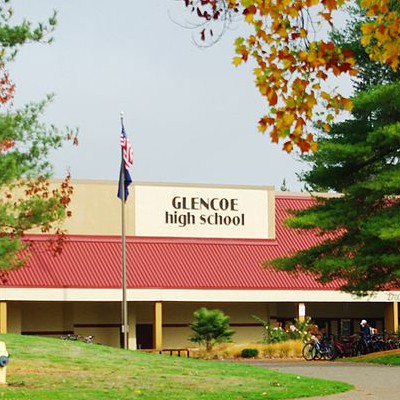
#70
Glencoe High
Hillsboro School District
Enrollment: 1601
Economically disadvantaged: 39%
Met or exceeded reading standards: 88.3%
Met or exceeded math standards: 70.5%
Met or exceeded writing standards: 58.4%
Met or exceeded science standards: 69.9%
Four year graduation rate: 77.1%
Prev
Next
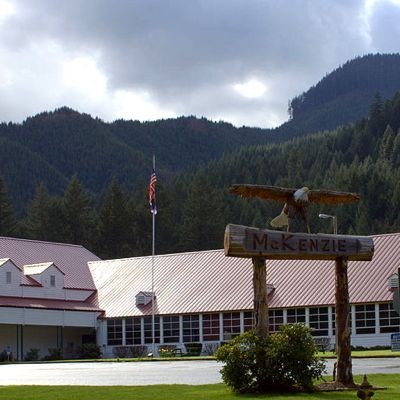
#69
McKenzie High
McKenzie School District
Enrollment: 67
Economically disadvantaged: 61%
Met or exceeded reading standards: 91.7%
Met or exceeded math standards: 41.7%
Met or exceeded writing standards: 50%
Met or exceeded science standards: 83.3%
Four year graduation rate: 68%
Photo Credit: Tedder - Own work. Licensed under CC BY 3.0 via Wikimedia Commons.

Prev
Next
#68
St. Helens High
St. Helens School District
Enrollment: 974
Economically disadvantaged: 36%
Met or exceeded reading standards: 91.4%
Met or exceeded math standards: 72.4%
Met or exceeded writing standards: 59.2%
Met or exceeded science standards: 66%
Four year graduation rate: 75.7%
Photo Credit: M.O. Stevens - Own work. Licensed under CC BY-SA 3.0 via Wikimedia Commons.
Prev
Next
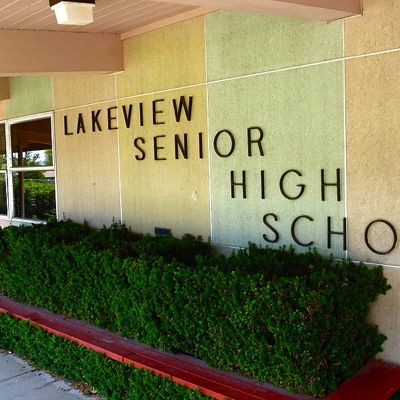
#67
Lakeview Senior High
Lake County School District
Enrollment: 223
Economically disadvantaged: 45%
Met or exceeded reading standards: 87.8%
Met or exceeded math standards: 69.4%
Met or exceeded writing standards: 66.7%
Met or exceeded science standards: 73.5%
Four year graduation rate: 88.1%
Prev
Next
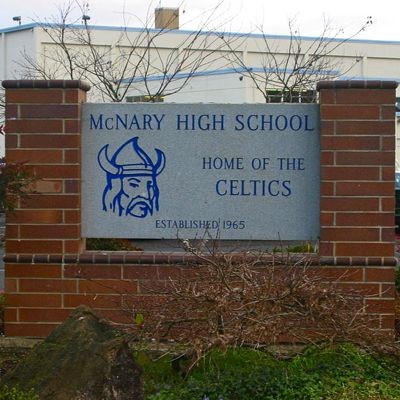
#66
McNary High
Salem-Keizer School District
Enrollment: 1924
Economically disadvantaged: 49%
Met or exceeded reading standards: 89.8%
Met or exceeded math standards: 75%
Met or exceeded writing standards: 59.5%
Met or exceeded science standards: 66.1%
Four year graduation rate: 82%

Prev
Next
#65
Banks High
Banks School District
Enrollment: 384
Economically disadvantaged: 23%
Met or exceeded reading standards: 91.5%
Met or exceeded math standards: 79.8%
Met or exceeded writing standards: 57.4%
Met or exceeded science standards: 81.1%
Four year graduation rate: 80.6%
Photo Credit: valakirka via Compfight cc

Prev
Next
#64
Clackamas Middle College
North Clackamas School District
Enrollment: 290
Economically disadvantaged: 28%
Met or exceeded reading standards: 91.4%
Met or exceeded math standards: 76.3%
Met or exceeded writing standards: 59.3%
Met or exceeded science standards: 78%
Four year graduation rate: 32.6%
Photo Credit: slightly everything via Compfight cc

Prev
Next
#63
South Medford High
Medford School District
Enrollment: 1698
Economically disadvantaged: 56%
Met or exceeded reading standards: 87.9%
Met or exceeded math standards: 76.8%
Met or exceeded writing standards: 61.7%
Met or exceeded science standards: 71.2%
Four year graduation rate: 80.4%
Photo Credit: @RunRockPrincess via Compfight cc
Prev
Next
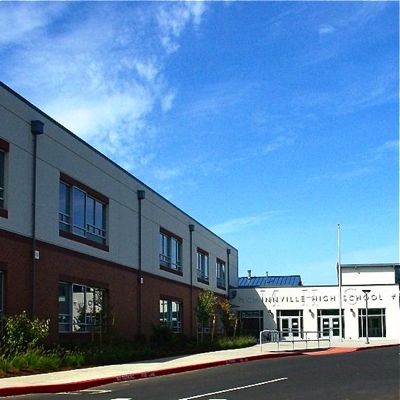
#62
McMinnville High
McMinnville School District
Enrollment: 1864
Economically disadvantaged: 48%
Met or exceeded reading standards: 91.1%
Met or exceeded math standards: 73.3%
Met or exceeded writing standards: 66%
Met or exceeded science standards: 64.6%
Four year graduation rate: 77.1%

Prev
Next
#61
Estacada High
Estacada School District
Enrollment: 589
Economically disadvantaged: 46%
Met or exceeded reading standards: 89.9%
Met or exceeded math standards: 77.7%
Met or exceeded writing standards: 59%
Met or exceeded science standards: 66.4%
Four year graduation rate: 71.8%

Prev
Next
#60
Philomath High
Philomath School District
Enrollment: 519
Economically disadvantaged: 29%
Met or exceeded reading standards: 82.8%
Met or exceeded math standards: 75%
Met or exceeded writing standards: 56.3%
Met or exceeded science standards: 69.5%
Four year graduation rate: 75%

Prev
Next
#59
Weston-McEwen High
Athena-Weston School District
Enrollment: 164
Economically disadvantaged: 33%
Met or exceeded reading standards: 97.5%
Met or exceeded math standards: 61.1%
Met or exceeded writing standards: 76.5%
Met or exceeded science standards: 47.2%
Four year graduation rate: 75.7%
Prev
Next
#58
Grants Pass High
Grants Pass School District
Enrollment: 1734
Economically disadvantaged: 55%
Met or exceeded reading standards: 90.3%
Met or exceeded math standards: 68.8%
Met or exceeded writing standards: 68.3%
Met or exceeded science standards: 72.3%
Four year graduation rate: 69%

Prev
Next
#57
North Eugene High
Eugene School District
Enrollment: 927
Economically disadvantaged: 54%
Met or exceeded reading standards: 88.1%
Met or exceeded math standards: 71.2%
Met or exceeded writing standards: 68.3%
Met or exceeded science standards: 63%
Four year graduation rate: 70.7%
Prev
Next
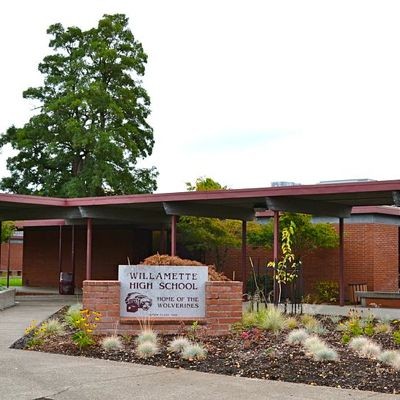
#56
Willamette High
Bethel School District
Enrollment: 1452
Economically disadvantaged: 48%
Met or exceeded reading standards: 89.6%
Met or exceeded math standards: 69.5%
Met or exceeded writing standards: 77.1%
Met or exceeded science standards: 68.2%
Four year graduation rate: 73%

Prev
Next
#55
Putnam High
North Clackamas School District
Enrollment: 1196
Economically disadvantaged: 39%
Met or exceeded reading standards: 88.6%
Met or exceeded math standards: 73.4%
Met or exceeded writing standards: 69.9%
Met or exceeded science standards: 59.3%
Four year graduation rate: 75.7%

Prev
Next
#54
Neah-Kah-Nie High
Neah-Kah Nie School District
Enrollment: 181
Economically disadvantaged: 54%
Met or exceeded reading standards: 83.7%
Met or exceeded math standards: 58.5%
Met or exceeded writing standards: 41.9%
Met or exceeded science standards: 97.5%
Four year graduation rate: 87.5%
Photo Credit: albertogp123 via Compfight cc
Prev
Next
#53
Scappoose High
Scappoose School District
Enrollment: 692
Economically disadvantaged: 28%
Met or exceeded reading standards: 89.6%
Met or exceeded math standards: 85.2%
Met or exceeded writing standards: 54.6%
Met or exceeded science standards: 84.4%
Four year graduation rate: 80.6%
Prev
Next
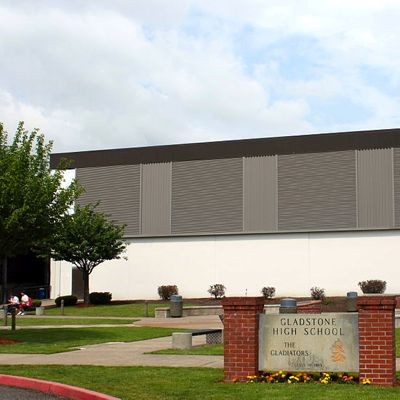
#52
Gladstone High
Gladstone School District
Enrollment: 677
Economically disadvantaged: 40%
Met or exceeded reading standards: 88.7%
Met or exceeded math standards: 77.5%
Met or exceeded writing standards: 66%
Met or exceeded science standards: 82.2%
Four year graduation rate: 78.9%
Prev
Next
#51
Franklin High
Portland School District
Enrollment: 1387
Economically disadvantaged: 56%
Met or exceeded reading standards: 89.2%
Met or exceeded math standards: 77.7%
Met or exceeded writing standards: 68.1%
Met or exceeded science standards: 59.8%
Four year graduation rate: 78.4%

Prev
Next
#50
Seaside High
Seaside High School
Enrollment: 453
Economically disadvantaged: 52%
Met or exceeded reading standards: 91.2%
Met or exceeded math standards: 70.3%
Met or exceeded writing standards: 60.8%
Met or exceeded science standards: 65.3%
Four year graduation rate: 69.5%

Prev
Next
#49
Siuslaw High
Siuslaw School District
Enrollment: 409
Economically disadvantaged: 53%
Met or exceeded reading standards: 89.4%
Met or exceeded math standards: 65.1
Met or exceeded writing standards: 73.3%
Met or exceeded science standards: 77.1%
Four year graduation rate: 65.9%
_400_400_90.JPG)
Prev
Next
#48
Century High
Hillsboro School District
Enrollment: 1608
Economically disadvantaged: 43%
Met or exceeded reading standards: 87.8
Met or exceeded math standards: 78.6%
Met or exceeded writing standards: 62.7%
Met or exceeded science standards: 72.9%
Four year graduation rate: 84.8%

Prev
Next
#47
Junction City High
Junction City School District
Enrollment: 532
Economically disadvantaged: 54%
Met or exceeded reading standards: 85.6%
Met or exceeded math standards: 76.8%
Met or exceeded writing standards: 56.8%
Met or exceeded science standards: 64.8%
Four year graduation rate: 65.1%
Photo Credit: crazytales562 via Compfight cc
Prev
Next
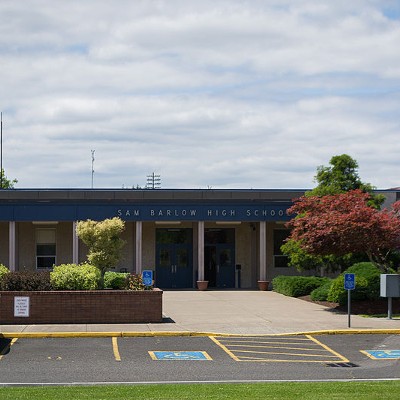
#46
Sam Barlow High
Gresham-Barlow School District
Enrollment: 1651
Economically disadvantaged: 38%
Met or exceeded reading standards: 84.5%
Met or exceeded math standards: 78.4%
Met or exceeded writing standards: 68.8%
Met or exceeded science standards: 76.7%
Four year graduation rate: 81.8%
Prev
Next
#45
Forest Grove High
Forrest Grove School District
Enrollment: 1779
Economically disadvantaged: 59%
Met or exceeded reading standards: 89.4%
Met or exceeded math standards: 85.7%
Met or exceeded writing standards: 66.6%
Met or exceeded science standards: 61.1%
Four year graduation rate: 72.5%
Prev
Next
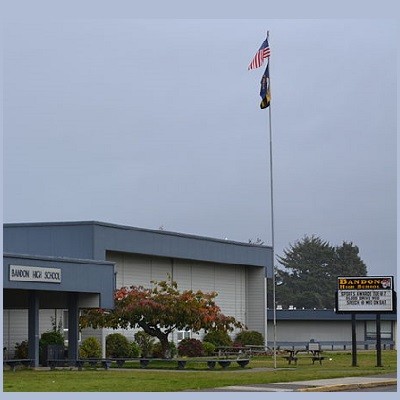
#44
Bandon Senior High
Bandon School District
Enrollment: 242
Economically disadvantaged: 60%
Met or exceeded reading standards: 86.1%
Met or exceeded math standards: 68.1%
Met or exceeded writing standards: 56.3%
Met or exceeded science standards: 70.4%
Four year graduation rate: 72.9%

Prev
Next
#43
South Salem High
Salem-Keizer School District
Enrollment: 1835
Economically disadvantaged: 49%
Met or exceeded reading standards: 89.5%
Met or exceeded math standards: 73.3%
Met or exceeded writing standards: 66.2%
Met or exceeded science standards: 66.5%
Four year graduation rate: 81.9%

Prev
Next
#42
Hood River Valley High
Hood River County School District
Enrollment: 1218
Economically disadvantaged: 57%
Met or exceeded reading standards: 87.1%
Met or exceeded math standards: 78.5%
Met or exceeded writing standards: 69.7%
Met or exceeded science standards: 53.5%
Four year graduation rate: 77.4%

Prev
Next
#41
North Douglas High
North Doughlas School District
Enrollment: 98
Economically disadvantaged: 45%
Met or exceeded reading standards: 91.3%
Met or exceeded math standards: 78.3%
Met or exceeded writing standards: 72.7%
Met or exceeded science standards: 60.9%
Four year graduation rate: 69%

Prev
Next
#40
Baker High
Baker School District
Enrollment: 501
Economically disadvantaged: 47%
Met or exceeded reading standards: 84.6%
Met or exceeded math standards: 73.6%
Met or exceeded writing standards: 65.9%
Met or exceeded science standards: 75.3%
Four year graduation rate: 77.8%
Prev
Next
#39
Oakland High
Oakland School District
Enrollment: 185
Economically disadvantaged: 50%
Met or exceeded reading standards: 91.5
Met or exceeded math standards: 83%
Met or exceeded writing standards: 68.1%
Met or exceeded science standards: 83%
Four year graduation rate: 86.1%
Prev
Next
#38
Newberg Senior High
Newberg School District
Enrollment: 1508
Economically disadvantaged: 42%
Met or exceeded reading standards: 87.9%
Met or exceeded math standards: 77.6%
Met or exceeded writing standards: 71.8%
Met or exceeded science standards: 68.3%
Four year graduation rate: 78.2%

Prev
Next
#37
West Salem High
Salem-Keizer School District
Enrollment: 1646
Economically disadvantaged: 35%
Met or exceeded reading standards: 92.7%
Met or exceeded math standards: 83.5%
Met or exceeded writing standards: 74.6%
Met or exceeded science standards: 74.2%
Four year graduation rate: 86.3%

Prev
Next
#36
Canby High
Canby School District
Enrollment: 1481
Economically disadvantaged: 32%
Met or exceeded reading standards: 87.3%
Met or exceeded math standards: 84%
Met or exceeded writing standards: 71.5%
Met or exceeded science standards: 61.6%
Four year graduation rate: 82.5%

Prev
Next
#35
Burns High
Harney County School District
Enrollment: 208
Economically disadvantaged: 33%
Met or exceeded reading standards: 76.2%
Met or exceeded math standards: 69%
Met or exceeded writing standards: 40.5%
Met or exceeded science standards: 83.3%
Four year graduation rate: 96.2%
Prev
Next
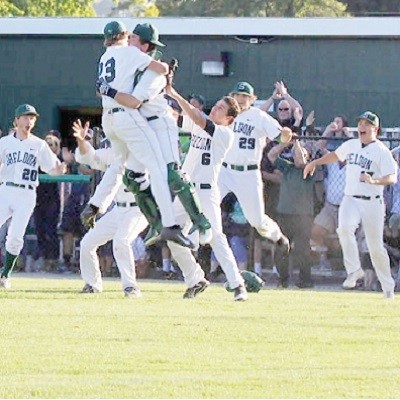
#34
Sheldon High
Eugene School District
Enrollment: 1399
Economically disadvantaged: 29%
Met or exceeded reading standards: 91.4%
Met or exceeded math standards: 77.7%
Met or exceeded writing standards: 69.1%
Met or exceeded science standards: 76.6%
Four year graduation rate: 72.4%
Prev
Next
#33
Oregon City Senior High
Oregon City School District
Enrollment: 2117
Economically disadvantaged: 34%
Met or exceeded reading standards: 97.5%
Met or exceeded math standards: 90.8%
Met or exceeded writing standards: 63%
Met or exceeded science standards: 76.7%
Four year graduation rate: 83%
Prev
Next
#32
Beaverton High
Beaverton School District
Enrollment: 1588
Economically disadvantaged: 43%
Met or exceeded reading standards: 90%
Met or exceeded math standards: 76.7%
Met or exceeded writing standards: 70.7%
Met or exceeded science standards: 65.4%
Four year graduation rate: 74.2%
Prev
Next
#31
Silverton High
Silver Falls School District
Enrollment: 1179
Economically disadvantaged: 41%
Met or exceeded reading standards: 86.1%
Met or exceeded math standards: 74.1%
Met or exceeded writing standards: 71.9%
Met or exceeded science standards: 72.1 %
Four year graduation rate: 77.7%
Prev
Next
#30
Colton High
Colton School District
Enrollment: 215
Economically disadvantaged: 28%
Met or exceeded reading standards: 90%
Met or exceeded math standards: 76%
Met or exceeded writing standards: 68%
Met or exceeded science standards: 85.1%
Four year graduation rate: 95.2%

Prev
Next
#29
Bend Senior High
Bend-LaPine School District
Enrollment: 1527
Economically disadvantaged: 40%
Met or exceeded reading standards: 92.7%
Met or exceeded math standards: 88.4%
Met or exceeded writing standards: 65.9%
Met or exceeded science standards: 75.6%
Four year graduation rate: 78.7%

Prev
Next
#28
Tualatin High
Tigard-Tualatin School District
Enrollment: 1714
Economically disadvantaged: 27%
Met or exceeded reading standards: 92.2%
Met or exceeded math standards: 76.7%
Met or exceeded writing standards: 62.9%
Met or exceeded science standards: 71.4%
Four year graduation rate: 84.4%

Prev
Next
#27
Mountain View Senior High
Bend-LaPine School District
Enrollment: 1283
Economically disadvantaged: 42%
Met or exceeded reading standards: 93.7%
Met or exceeded math standards: 82%
Met or exceeded writing standards: 75.2%
Met or exceeded science standards: 76.1%
Four year graduation rate: 78.3%
Photo Credit: Vince Kusters via Compfight cc

Prev
Next
#26
Tigard High
Tigard-Tualatin School District
Enrollment: 1835
Economically disadvantaged: 32%
Met or exceeded reading standards: 92.7%
Met or exceeded math standards: 83.5%
Met or exceeded writing standards: 64.5%
Met or exceeded science standards: 67.7%
Four year graduation rate: 80.8%
Prev
Next
#25
Sherwood High
Sherwood School District
Enrollment: 1469
Economically disadvantaged: 15%
Met or exceeded reading standards: 97.5%
Met or exceeded math standards: 85.8%
Met or exceeded writing standards: 62.2%
Met or exceeded science standards: 84.8%
Four year graduation rate: 91.3%
Prev
Next
#24
Corvallis High
Corvallis School District
Enrollment: 1184
Economically disadvantaged: 32%
Met or exceeded reading standards: 87.5%
Met or exceeded math standards: 79.8%
Met or exceeded writing standards: 69.2%
Met or exceeded science standards: 76.4%
Four year graduation rate: 70.7%

Prev
Next
#23
Sprague High
Salem-Keizer School District
Enrollment: 1608
Economically disadvantaged: 32%
Met or exceeded reading standards: 97.5%
Met or exceeded math standards: 86.2%
Met or exceeded writing standards: 72.5%
Met or exceeded science standards: 79.6%
Four year graduation rate: 82.2%
Photo Credit: Jirka Matousek via Compfight cc
Prev
Next
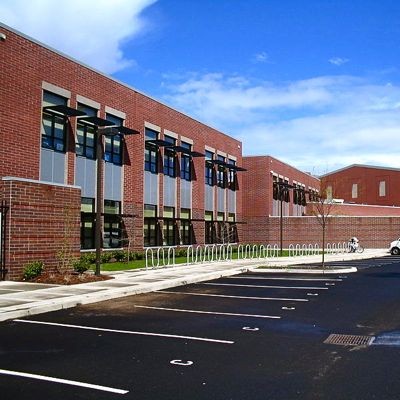
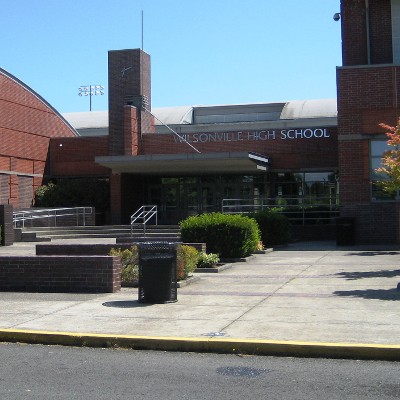
#22
Wilsonville High
West Linn-Wilsonville School District
Enrollment: 1093
Economically disadvantaged: 24%
Met or exceeded reading standards: 92.5%
Met or exceeded math standards: 74.1%
Met or exceeded writing standards: 74.2%
Met or exceeded science standards: 71.3%
Four year graduation rate: 85%

Prev
Next
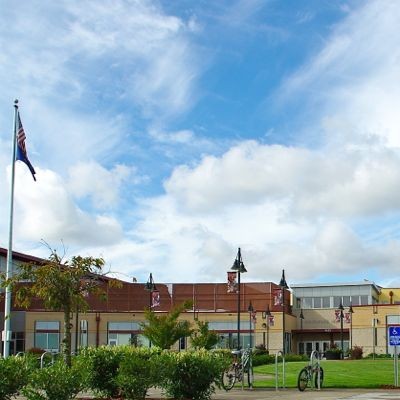
#21
West Albany High
Greater Albany Public School District
Enrollment: 1317
Economically disadvantaged: 28%
Met or exceeded reading standards: 92.3%
Met or exceeded math standards: 87.5%
Met or exceeded writing standards: 75%
Met or exceeded science standards: 84.9%
Four year graduation rate: 93.6%
Photo Credit: jonas maaloe via Compfight cc

Prev
Next
#20
Clackamas High
North Clackamas School District
Enrollment: 2230
Economically disadvantaged: 29%
Met or exceeded reading standards: 91.7%
Met or exceeded math standards: 85.7%
Met or exceeded writing standards: 80.5%
Met or exceeded science standards: 74.2%
Four year graduation rate: 85.5%
Prev
Next
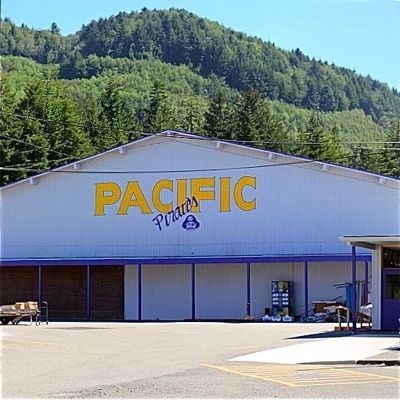
#19
Pacific High
Port Orford-Langlois School District
Enrollment: 90
Economically disadvantaged: 53%
Met or exceeded reading standards: 90.9%
Met or exceeded math standards: 59.1%
Met or exceeded writing standards: 77.3%
Met or exceeded science standards: 68.2%
Four year graduation rate: 78.3%
Photo Credit: Tedder - Own work. Licensed under CC BY 3.0 via Wikimedia Commons.
Prev
Next
#18
Southridge High
Beaverton School District
Enrollment: 1722
Economically disadvantaged: 27%
Met or exceeded reading standards: 91.5%
Met or exceeded math standards: 80.4%
Met or exceeded writing standards: 66.3%
Met or exceeded science standards: 68.9%
Four year graduation rate: 88.5%
Prev
Next
#17
Sisters High
Sisters School District
Enrollment: 480
Economically disadvantaged: 28%
Met or exceeded reading standards: 93.5%
Met or exceeded math standards: 74.1%
Met or exceeded writing standards: 77.8%
Met or exceeded science standards: 83.3%
Four year graduation rate: 88.4%

Prev
Next
#16
Glide High
Glide School District
Enrollment: 215
Economically disadvantaged: 45%
Met or exceeded reading standards: 97.5%
Met or exceeded math standards: 70.8%
Met or exceeded writing standards: 68.8%
Met or exceeded science standards: 93.8%
Four year graduation rate: 86.7%
Photo Credit: racka_abe via Compfight cc

Prev
Next
#15
Summit High
Bend-LaPine School District
Enrollment: 1344
Economically disadvantaged: 22%
Met or exceeded reading standards: 93.3%
Met or exceeded math standards: 74.6%
Met or exceeded writing standards: 73.6%
Met or exceeded science standards: 73.6%
Four year graduation rate: 88.3%
Photo Credit: frankjuarez via Compfight cc

Prev
Next
#14
Grant High
Portland School District
Enrollment: 1489
Economically disadvantaged: 24%
Met or exceeded reading standards: 92.6%
Met or exceeded math standards: 83.3%
Met or exceeded writing standards: 70.3%
Met or exceeded science standards: 66.4%
Four year graduation rate: 84.3%
Prev
Next
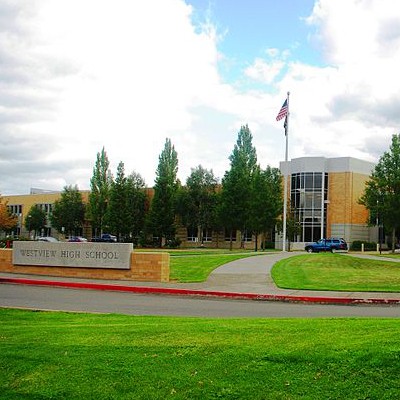
#13
Westview High
Beaverton School District
Enrollment: 2418
Economically disadvantaged: 33%
Met or exceeded reading standards: 92.2%
Met or exceeded math standards: 81.8%
Met or exceeded writing standards: 75.4%
Met or exceeded science standards: 70.3%
Four year graduation rate: 80.1%
Prev
Next
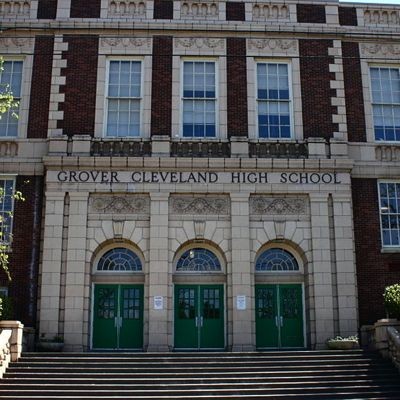
#12
Cleveland High
Portland School District
Enrollment: 1457
Economically disadvantaged: 29%
Met or exceeded reading standards: 92.6%
Met or exceeded math standards: 80.2%
Met or exceeded writing standards: 81.4%
Met or exceeded science standards: 59.7%
Four year graduation rate: 76.2%
Tedder - Own work. Licensed under CC BY 3.0 via Wikimedia Commons.

Prev
Next
#11
Sunset High
Beaverton School District
Enrollment: 1942
Economically disadvantaged: 29%
Met or exceeded reading standards: 94.7%
Met or exceeded math standards: 83.3%
Met or exceeded writing standards: 76.8%
Met or exceeded science standards: 79.7%
Four year graduation rate: 81.4%

Prev
Next
#10
Wilson High
Portland School District
Enrollment: 1185
Economically disadvantaged: 22%
Met or exceeded reading standards: 91.8%
Met or exceeded math standards: 80.4%
Met or exceeded writing standards: 82.8%
Met or exceeded science standards: 63.8%
Four year graduation rate: 84.4%
Photo Credit: KristinNador via Compfight cc

Prev
Next
#9
Ashland High
Ashland School District
Enrollment: 940
Economically disadvantaged: 28%
Met or exceeded reading standards: 97.5%
Met or exceeded math standards: 85.8%
Met or exceeded writing standards: 79.8%
Met or exceeded science standards: 77.2%
Four year graduation rate: 86.1%
Prev
Next
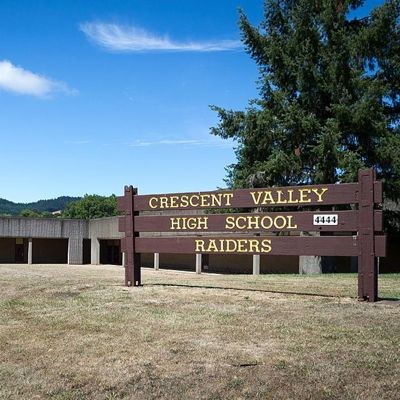
#8
Crescent Valley High
Corvallis School District
Enrollment: 965
Economically disadvantaged: 23%
Met or exceeded reading standards: 97.5%
Met or exceeded math standards: 85.3%
Met or exceeded writing standards: 78.1%
Met or exceeded science standards: 77.8%
Four year graduation rate: 70.1%
Photo Credit: Visitor7 - Own work. Licensed under CC BY-SA 3.0 via Wikimedia Commons.

Prev
Next
#7
West Linn High
West Linn-Wilsonville School District
Enrollment: 1514
Economically disadvantaged: 10%
Met or exceeded reading standards: 97.5%
Met or exceeded math standards: 87.9%
Met or exceeded writing standards: 85.8%
Met or exceeded science standards: 83.2%
Four year graduation rate: 93.2%
Photo Credit: Tedder - Own work. Licensed under CC BY 3.0 via Wikimedia Commons.

Prev
Next
#6
Riverdale High
Riverdale School District
Enrollment: 242
Economically disadvantaged: <6%*
Met or exceeded reading standards: 97.5%
Met or exceeded math standards: 89.8%
Met or exceeded writing standards: 74.6%
Met or exceeded science standards: 74.6%
Four year graduation rate: 94.2%
*numbers less than 6% are represented by an asterisk in the Oregon Department of Education data.

Prev
Next
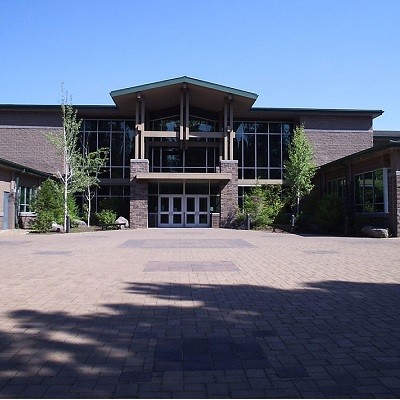
#5
School of Science & Technology
Beaverton School District
Enrollment: 167
Economically disadvantaged: 20%
Met or exceeded reading standards: 97.5%
Met or exceeded math standards: 97.5%
Met or exceeded writing standards: 86%
Met or exceeded science standards: 63.9%
Four year graduation rate: 81.1%
Photo Credit: Maya83 via Compfight cc
Prev
Next
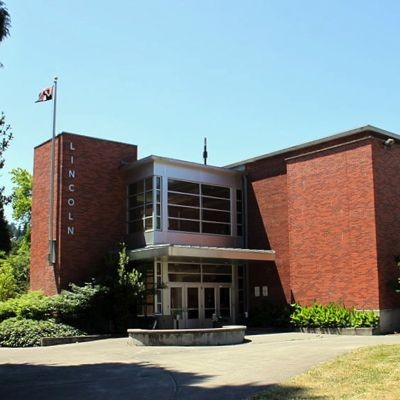
#4
Lincoln High
Portland School District
Enrollment: 1471
Economically disadvantaged: 12%
Met or exceeded reading standards: 92.5%
Met or exceeded math standards: 85.3%
Met or exceeded writing standards: 88.1%
Met or exceeded science standards: 79.9%
Four year graduation rate: 89.3%
Photo Credit: Tedder - Own work. Licensed under CC BY 3.0 via Wikimedia Commons.
Prev
Next
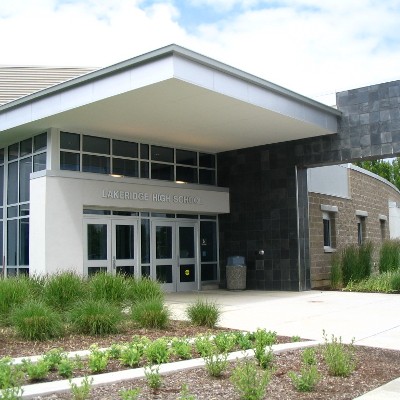
#3
Lakeridge High
Lake Oswego School District
Enrollment: 1078
Economically disadvantaged: 8%
Met or exceeded reading standards: 97.5%
Met or exceeded math standards: 93.9%
Met or exceeded writing standards: 91.8%
Met or exceeded science standards: 92.1%
Four year graduation rate: 89.8%

Prev
Next
#2
South Eugene High
Eugene School District
Enrollment: 1321
Economically disadvantaged: 24%
Met or exceeded reading standards: 97.5%
Met or exceeded math standards: 91.6%
Met or exceeded writing standards: 84.9%
Met or exceeded science standards: 89.2%
Four year graduation rate: 79.4%
Photo Credit: katalicia1 via Compfight cc

Prev
Next
#1
Lake Oswego Senior High
Lake Oswego School District
Enrollment: 1224
Economically disadvantaged: 6%
Met or exceeded reading standards: 97.5%
Met or exceeded math standards: 92.4%
Met or exceeded writing standards: 89.1%
Met or exceeded science standards: 87.7%
Four year graduation rate: 89.5%
Photo Credit: KristinNador via Compfight cc
Related Articles
- Scott Bruun: Education, Priorities, and the Governor’s Budget
- Some Oregon Industries Hurt By Push For Higher Education
- Who’s Hot and Who’s Not in Oregon Politics: The Race for Mayor, Education, Ducks
- PSU To Build New Education Center Shared with OHSU
- Portland Teachers Balking at Special Education Redesign
- Mother & Child Education Center Hosts Charity Dinner for Mother’s Day
- National Spokesperson for Sex Education Coming to Portland
- Portland High School Shooting: Ceasfire Oregon to Hold Gunfire Violence Call to Action TONIGHT
- Vancouver Public Schools Earn Grant Funding for School Behavioral Services
- UPDATED: Portland Police Make Arrest in High School Shooting Case
- UPDATED: Parent Files Federal Lawsuit Against Portland Public Schools
- The Top 100 High Schools in Oregon
- Portland High School Shooting: Love Your Kids, Give Them A Hug, Mayor Says
- Party Report: Ain’t Misbehavin’ Benefit for German American School
- Oregon Virtual Public Schools Offer Options, But Numbers Show a Lack in Quality
- Parkrose Middle School’s Molly Ouche Named Principal of the Year
- Portland High School Shooting: Third Suspect Arrested
- Portland High Schoolers Study: Media Saturation Better for Multitasking
- Portland’s Charter Schools Whiter Than Its Public Schools
- Public School Teachers And Their PR Problem
- Portland Waldorf School Hosts Benefit with Storm Large
- Portland Student Threatens to Burn Down High School
- Portland Metro’s Top High Schools
- Oregon Episcopal School Among 25 Smartest Boarding Schools in U.S.
- Oregon Elementary School Teachers Paid Far Less Than California Teachers
- Live Storytelling Event Benefits BTA’s Safe Routes to School Program
- Methodology: Oregon’s Top High Schools 2014
- Knowledge Universe and Partners Donate School Supplies to Students at Beach Elementary
- K-12 Schools Budget Passes Oregon House on Party-Line Vote
- Jefferson High School Field Dedication
- NEW: Beaverton Students Behind School Shooting Rumor “Thought It Would Be Funny”
- NEW: North Portland High School Shooting: Victim Released, Second Suspect Arrested
- North Portland School Shooting: I heard four shots, then somebody yelling
- NW Academy Puts on High School Musical Inspired by Bosnian War
- NEW: Suspects in Portland School Shooting Charged with Attempted Murder
- NEW: Portland High School Shooting: Rosemary Anderson, School For Troubled Students
- NEW: OR Schools get C- on National Report Card
- Ranking of Student Diversity in Pac-12 Schools
- Rex Burkholder: Restoring Oregon’s Outdoor School Tradition
- Education Institutions Receive Major Grants From NW Natural
Enjoy this post? Share it with others.
Email to a friend
Permalink


_80_80_90_c1.JPG)


Follow us on Pinterest Google + Facebook Twitter See It Read It