Welcome! Login | Register
 

Derek Jeter, Kobe Bryant, Tom Brady … Russell Wilson?—Derek Jeter, Kobe Bryant, Tom Brady … Russell…

U.S. Unemployment Claims Soar to Record-Breaking 3.3 Million During Coronavirus Crisis—U.S. Unemployment Claims Soar to Record-Breaking 3.3 Million…

Harlem Globetrotters Icon Fred “Curley” Neal Passes Away at 77—Harlem Globetrotters Icon Fred “Curley” Neal Passes Away…

Boredom Busters – 3 Games The Family Needs While The World Waits For Sports—Boredom Busters – 3 Games The Family Needs…

REPORT: 2020 Olympics to be Postponed Due to Coronavirus Emergency—REPORT: 2020 Olympics to be Postponed Due to…

Convicted Rapist Weinstein Has Coronavirus, According to Reports—Convicted Rapist Weinstein Has Coronavirus, According to Reports

“Does Anyone Care About Politics Right Now?”—Sunday Political Brunch March 22, 2020—“Does Anyone Care About Politics Right Now?” --…

U.S. - Canada Border to Close for Non-Essential Travel—U.S. - Canada Border to Close for Non-Essential…

Broken Hearts & Lost Games – How The Coronavirus Affected Me—Broken Hearts & Lost Games – How The…

White House Considering Giving Americans Checks to Combat Economic Impact of Coronavirus—White House Considering Giving Americans Checks to Combat…


How Portland’s Growing Population Will Affect Its Public Schools

Thursday, April 16, 2015


School enrollment is booming in Portland schools as projections by Portland State University estimate 13 percent more students by the 2028-29 school year. 

As enrollment lines trend upward in Portland Public Schools, a district-wide committee is rethinking boundary changes for the fall 2016 school year due to lack of space for a growing student population. This might mean reopening closed schools, said Christine Miles, Portland Public Schools spokesperson. “Whenever there is a projection of more student enrollment we have to take a look at whether our schools have capacity,” said Miles.

This is the fifth consecutive year of enrollment growth preceded by 12 consecutive years of enrollment losses between 1996-97 and 2008-09. Interestingly, that does not coincide with the overall population growth of the residents living within the school district boundaries—total population has been going up since about 1980. 

Enrollment was around 45,000 in 2008-09. This year, enrollment stands at about 48,500. Most of that growth has been at the elementary level, while high school grades have yet to rebound.

Now on the brink of a fresh chance to decide where students will attend to school—with the possibility to address uneven enrollment and inequality—it wasn’t very long ago that some district families experienced a school closure. The district made the decision to close Marshall High School in 2011 and redraw boundaries for its feeder schools. High schools closures have only been felt once before in the district in the 80s during an enrollment dip. In 2013, the district also consolidated Chief Joseph Elementary and Ockley Green K-8.

Additionally, the school district may have to re-consider how it is spending its $482 million building improvement bond, which passed voter approval in 2012, said Miles. 

This summer, the school district plans to begin rebuilds of Franklin and Roosevelt high schools and demolish Faubion PreK-8 for complete replacement. Grant High School will be rebuilt beginning in 2017, and many other schools will receive maintenance updates and seismic upgrades. Some of the money will also fund planning phases for rebuilds of Lincoln, Benson and Madison high schools.

“We’d hate to overbuild or underbuild,” said Miles. 

These decisions hinge on forecasts by Portland State University’s Population Research Center, which calculates enrollment projections annually. The last one came out in 2014 and is based on historical data through 2013. It makes projections through the 2028-29 school year. 

While this is the 15th consecutive year of forecasts from PSU’s Population Research Center, the last four years have proven more accurate than earlier projections. Initially, the center had predicted declining enrollment until 2011-12, but enrollment actually declined only until 2008-09. 

Its projections are made by grade-level as well as by high school cluster—which include all the elementary and middle feeder schools. The school forecasts assume no changes to boundaries for the 15-year horizon—something that will likely change through the boundary review process. 

In the last five years, the Cleveland, Grant and Lincoln high school clusters have increased the most—each gaining between 12 and 14 percent in student population.

Over the next 15 years, the Lincoln and Wilson high school clusters are projected to increase between 21 and 22 percent. All high school clusters are projected to grow, however, with Madison having the lowest growth rate of 7 percent over 15 years.

PSU considered a variety of factors to make its projections, including housing projections, birth rates and migration patterns. 

Ultimately, the report implies that migration is the biggest factor in enrollment boosts. During the 2000s, there was more migration to Portland than in the 90s. The inflow of young adults moving to Portland in the 2000s is estimated at 48,000, offset by about 31,000 (from all age groups) who left, resulting in a net gain of 17,000. This is a similar pattern to the 90s only on a slightly bigger scale.

PSU’s medium-scenario projection anticipates a net gain of even more people than in previous years, meaning about 42,000 more people could live within the district boundaries by 2030. 

Birth rates have also picked up from the mid-90s to the mid-2000s, which is having some impact. Previously, they had dropped rather drastically. For example, for children entering kindergarten between 2003-2006, there were 36 to 38 percent fewer births five years earlier (between 1998 and 2001). This reversed in 2007.

There will also be a slight increase in kindergarteners this fall when Oregon begins its first year of full-day tuition-free kindergarten.

Another factor that appears to play a role in birthrate changes and ultimately seems to benefit Portland Public Schools is the age at which women are having children. In 2012, the median age women were having children was 32.3; in 1995, it was 28. “The living arrangements of residents who have children at an older age are likely to be more established,” said the report, which concludes that older women are not moving once they have their children. In previous years, young adults who rented in the urban center moved to other parts of the metro as their children grew.

Available housing still plays a role, though Portland Public Schools has historically had fewer students per household than suburban areas. Families living in single-family homes built since 2003 include only about .40 children under 10. Older single-family homes, apartments, condos, duplexes and triplexes have fewer children.

Looking at the future, the next wave of development is likely to have mostly one-bedroom or smaller market-rate apartments, and PSU expects very few students to live in them.


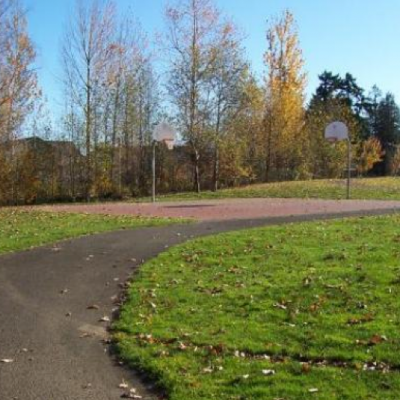
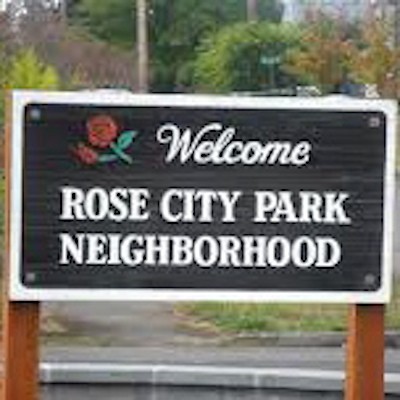
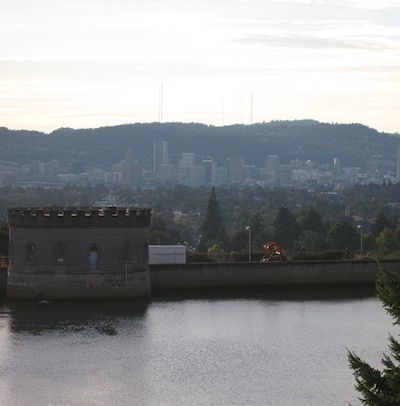
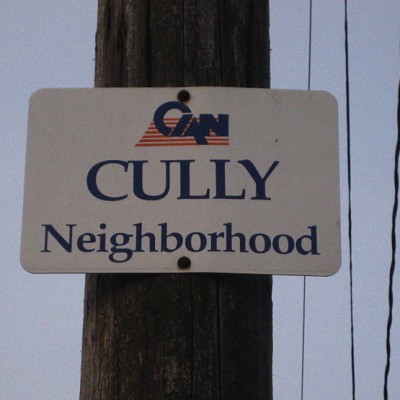
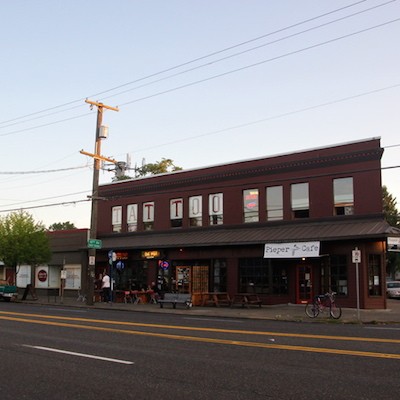
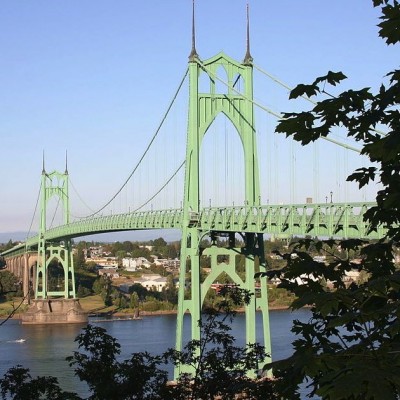
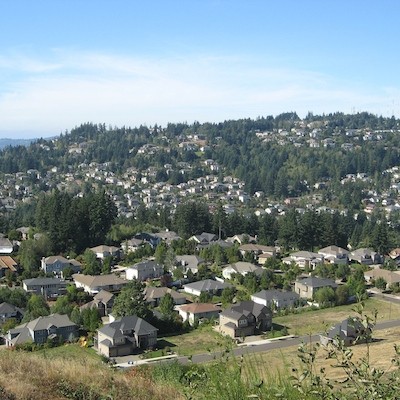
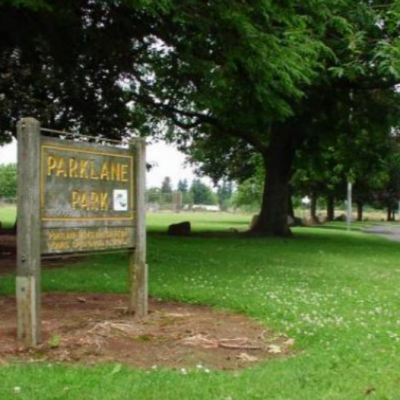
Related Slideshow: Portland’s 20 Hottest Neighborhoods for Real Estate

What are Portland’s hottest neighborhoods for real estate? The 20 neighborhoods below are ranked by the number of sold homes over the last 90 days. The information, along with the median list price and median price per square foot, comes from the real estate company Redfin. The population is from 2010 census data. 

The sale to list percentage, also from Redfin, is the final selling price over what the listed price was, to show how close sellers came to their asking price. In cases where it is over 100 percent, the seller got more than then listed price. 

Find out what the hottest real estate neighborhoods in Portland are: 

Prev Next

#20 (tied)

Wilkes  

# of Homes Sold Over the Last 90 Days: 34

Median List Price: $259,925

Median Price Per Square Foot: $143

Sale to List Percentage: 98.1%

Population: 8,775

Note: Sale to List Percentage shows how close the sale price was to the listed price.

Prev Next

#19 (tied)

Rose City Park

# of Homes Sold Over the Last 90 Days: 34

Median List Price: $489,700

Median Price Per Square Foot: $287

Sale to List Percentage: 98.3%

Population: 8,982

Note: Sale to List Percentage shows how close the sale price was to the listed price.

Prev Next

#18 (tied)

Richmond

# of Homes Sold Over the Last 90 Days: 34

Median List Price: $497,000

Median Price Per Square Foot: $345

Sale to List Percentage: 98.9%

Population: 11,607

Note: Sale to List Percentage shows how close the sale price was to the listed price.

Prev Next

#17

Downtown

# of Homes Sold Over the Last 90 Days: 36

Median List Price: $394,500

Median Price Per Square Foot: $442

Sale to List Percentage: 97.5%

Population: 12,801

Note: Sale to List Percentage shows how close the sale price was to the listed price.

Prev Next

#16 (tied)

Mount Tabor

# of Homes Sold Over the Last 90 Days: 38

Median List Price: $574,900

Median Price Per Square Foot: $356

Sale to List Percentage: 99.2%

Population: 10,162

Note: Sale to List Percentage shows how close the sale price was to the listed price.

Prev Next

#15 (tied)

Cully

# of Homes Sold Over the Last 90 Days: 38

Median List Price: $235,000

Median Price Per Square Foot: $180

Sale to List Percentage: 100.3%

Population: 13,209

Note: Sale to List Percentage shows how close the sale price was to the listed price.

Prev Next

#14 (tied)

Mount Scott-Arleta

# of Homes Sold Over the Last 90 Days: 39

Median List Price: $249,974

Median Price Per Square Foot: $178

Sale to List Percentage: 98.7%

Population: 7,397

Note: Sale to List Percentage shows how close the sale price was to the listed price.

Prev Next

#13 (tied)

Concordia

# of Homes Sold Over the Last 90 Days: 39

Median List Price: $249,974

Median Price Per Square Foot: $178

Sale to List Percentage: 98.7%

Population: 9,550

Note: Sale to List Percentage shows how close the sale price was to the listed price.

Prev Next

#12 (tied)

St. Johns

# of Homes Sold Over the Last 90 Days: 42

Median List Price: $234,925

Median Price Per Square Foot: $164

Sale to List Percentage: 97.6%

Population: 12,207

Note: Sale to List Percentage shows how close the sale price was to the listed price.

Prev Next

#11 (tied)

Corbett

# of Homes Sold Over the Last 90 Days: 42

Median List Price: $574,950

Median Price Per Square Foot: $361

Sale to List Percentage: 98.2%

Population: 7,088

Note: Sale to List Percentage shows how close the sale price was to the listed price.

Prev Next

#10

Portsmouth

# of Homes Sold Over the Last 90 Days: 43

Median List Price: $225,000

Median Price Per Square Foot: $172

Sale to List Percentage: 101.1%

Population: 9,789

Note: Sale to List Percentage shows how close the sale price was to the listed price.

Prev Next

#9

Mount Scott

# of Homes Sold Over the Last 90 Days: 44

Median List Price: $274,700

Median Price Per Square Foot: $185

Sale to List Percentage: 97.8%

Population (Mount Scott-Arleta): 7,397

Note: Sale to List Percentage shows how close the sale price was to the listed price.

Prev Next

#8

Centennial

# of Homes Sold Over the Last 90 Days: 50

Median List Price: $203,000

Median Price Per Square Foot: $153

Sale to List Percentage: 99.6%

Population: 23,662

Note: Sale to List Percentage shows how close the sale price was to the listed price.

Prev Next

#7

Pearl

# of Homes Sold Over the Last 90 Days: 51

Median List Price: $500,000

Median Price Per Square Foot: $445

Sale to List Percentage: 98.9%

Population: 5,997

Note: Sale to List Percentage shows how close the sale price was to the listed price.

Prev Next

#6

Beaumont

# of Homes Sold Over the Last 90 Days: 54

Median List Price: $699,900

Median Price Per Square Foot: $253

Sale to List Percentage: 101.3%

Population: 5,346

Note: Sale to List Percentage shows how close the sale price was to the listed price.

Prev Next

#5

Hazelwood

# of Homes Sold Over the Last 90 Days: 56

Median List Price: $225,000

Median Price Per Square Foot: $166

Sale to List Percentage: 98.3%

Population: 23,462

Note: Sale to List Percentage shows how close the sale price was to the listed price.

Prev Next

#4

Brentwood

# of Homes Sold Over the Last 90 Days: 58

Median List Price: $184,950

Median Price Per Square Foot: $161

Sale to List Percentage: 99.3%

Population (Brentwood-Darlington): 12,994

Note: Sale to List Percentage shows how close the sale price was to the listed price.

Prev Next

#3

Powellhurst-Gilbert

# of Homes Sold Over the Last 90 Days: 67

Median List Price: $214,950

Median Price Per Square Foot: $164

Sale to List Percentage: 97.9%

Population: 30,639

Note: Sale to List Percentage shows how close the sale price was to the listed price.

Prev Next

#2

Montavilla

# of Homes Sold Over the Last 90 Days: 67

Median List Price: $222,500

Median Price Per Square Foot: $201

Sale to List Percentage: 100%

Population: 16,287

Note: Sale to List Percentage shows how close the sale price was to the listed price.

Prev Next

#1

Brentwood-Darlington

# of Homes Sold Over the Last 90 Days: 81

Median List Price: $212,450

Median Price Per Square Foot: $178

Sale to List Percentage: 99.3%

Population: 12,994

Note: Sale to List Percentage shows how close the sale price was to the listed price.


Related Articles


Enjoy this post? Share it with others.

 
Delivered Free Every
Day to Your Inbox