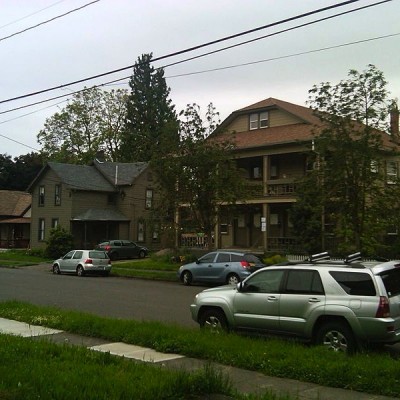
Hey GoLocalPDX, East Portland isn’t so Dangerous After All


 Email to a friend
Permalink
Email to a friend
Permalink
Friday, October 24, 2014
Jesse Cornett, Guest MINDSETTER
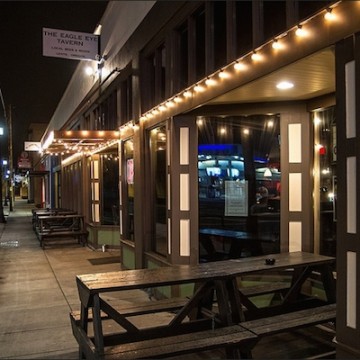
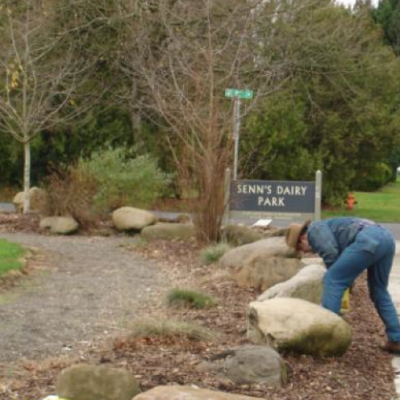
Photo Credit: Adam Simmons (image cropped)
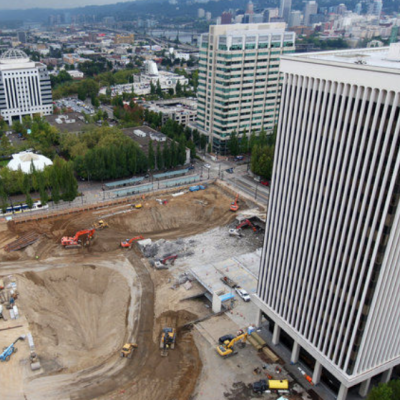
GoLocalPDX’s article Wednesday attempting to define what constitutes a dangerous neighborhood shows errors in methodology and raises a lot of questions. As a neighborhood activist and longtime East Portland resident, feel several issues need to be addressed.
East Portland vs. Downtown
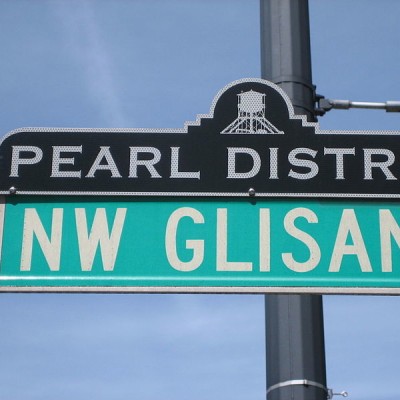
First, the article manipulates numbers to designate East Portland neighborhoods as unsafe. The article does not adequately weight population. If you do, it is clear that Downtown and the posh Pearl District are exponentially more dangerous than any East Portland neighborhood. Hazelwood, for instance has a rate of 213 calls for police service per 1000 residents over the past five years while downtown has a staggering 722. The Pearl, at 647, isn’t far behind. In raw numbers, Downtown, a smaller neighborhood had more larceny and indeed more rape incidents than Lents, where I reside, yet it received a much high safety ranking than Lents. Based on population, if Lents were its own city, we would be the 25th largest city in Oregon (larger than Sherwood) yet are being compared to neighborhoods that literally have less than 200 residents.
Property Crimes as "Violent" Crimes
Further the article considers property crimes such car breakins and shoplifting as “violent” crimes. A single store located in Eastport Plaza places approximately two calls per day for police service. These are shoplifting calls. That alone would account for more than half of the total calls for Lents. They are not violent offenses and do not equate to us being “dangerous.”
Traffic Accidents
GoLocalPDX also gives heavy consideration to traffic accidents when considering dangerous neighborhoods. Unfortunately they miss the mark there too. Limiting crash data to only high crash intersections ignores the majority of traffic crashes that occur all over Portland. The article includes data on 3468 crashes at 60 intersections across the city. In a city with thousands of intersections and over 50,000 vehicle crashes in the same period, this would be akin to judging the total worth of someone by the quality of their left hand alone. There were 146 traffic fatalities during the measured period, though the article only accounted for 55.
Finally, attributing an intersection to one neighborhood over another when it crosses boundaries also muddies the water. For instance, 82nd and Flavel connects Brentwood Darlington and Lents yet Brentwood Darlington is listed as having no dangerous intersections (while Lents is listed as having seven). To achieve a defensible statistic, those wrecks should be equally apportioned between the neighborhoods.
There is no doubt that traffic safety improvements are needed throughout East Portland. Having as many unsafe intersections as we do is a shame. The facts, however, speak for themselves. We don’t need Lents ranked as more dangerous than three of our adjacent neighborhoods to the West to know that we need our shared infrastructures fixed.
Jesse is the Chair of the Lents Neighborhood Association.
Homepage Photo Credit: Public Domain via Wikipedia Commons (image cropped)
Related Slideshow: Portland’s 35 Most Dangerous Neighborhoods
* Rankings have been adjusted since their original posting to better reflect all neighborhood boundaries that make contact with the city's most dangerous intersections.
Prev
Next
#35
Buckman-East
Calls for police: 1,714
Fire incidents: 162
City's most dangerous intersections: none
*Police stats are violent crimes only. Both police and fire stats represent totals for five years
Prev
Next
#34
Overlook
Calls for police: 1,792
Fire incidents: 139
City's most dangerous intersections: none
*Police stats are violent crimes only. Both police and fire stats represent totals for five years
Prev
Next
#33
King
Calls for police: 1,431
Fire incidents: 115
City's most dangerous intersections:
- Northeast Killingsworth St./ Northeast Martin Luther King Jr. Blvd. Total crashes: 57
*Police stats are violent crimes only. Both police and fire stats represent totals for five years
Prev
Next
#32
Buckman-West
Calls for police: 2,547
Fire incidents: 213
City's most dangerous intersections: none
*Police stats are violent crimes only. Both police and fire stats represent totals for five years
Prev
Next
#31
Kerns
Calls for police: 1,853
Fire incidents: 165
City's most dangerous intersections: none
*Police stats are violent crimes only. Both police and fire stats represent totals for five years
Prev
Next
#30
Hosford-Abernethy
Calls for police: 2,248
Fire incidents: 126
City's most dangerous intersections:
- Southeast 7th Ave./ Southeast Powell Blvd. Total crashes: 114
*Police stats are violent crimes only. Both police and fire stats represent totals for five years
Prev
Next
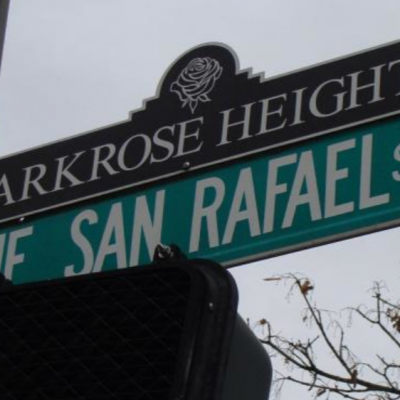
#29
Parkrose Heights
Calls for police: 1,064
Fire incidents: 86
City's most dangerous intersections:
- Northeast 122nd Ave./ Northeast Halsey St. Total crashes: 99
- Northeast 102nd Ave./ Northeast Halsey St. Total crashes: 56
*Police stats are violent crimes only. Both police and fire stats represent totals for five years
Prev
Next
#28
Creston-Kenilworth
Calls for police: 1,750
Fire incidents: 133
City's most dangerous intersections:
- Southeast Cesar E Chavez Blvd. / Southeast Powell Blvd.Total crashes: 104
- Southeast 50th Ave. / Southeast Foster Rd. / Southeast Powell Blvd. Total crashes: 53
*Police stats are violent crimes only. Both police and fire stats represent totals for five years
Prev
Next
#27
Hayden Island
Calls for police: 2,043
Fire incidents: 136
City's most dangerous intersections: none
*Police stats are violent crimes only. Both police and fire stats represent totals for five years
Prev
Next
#26
Wilkes
Calls for police: 1,269
Fire incidents: 102
City's most dangerous intersections: none
*Police stats are violent crimes only. Both police and fire stats represent totals for five years
Prev
Next
#25
Pleasant Valley
Calls for police: 1,102
Fire incidents: 89
City's most dangerous intersections:
- Southeast 174th Ave./ Southeast Powell Blvd. Total crashes: 111
- Southeast 122nd Ave. / Southeast Foster Rd. Total crashes: 53
- Southeast 148th Ave. / Southeast Stark St. Total crashes: 96
*Police stats are violent crimes only. Both police and fire stats represent totals for five years
Prev
Next
#24
Lloyd
Calls for police: 4851
Fire incidents: 187
City's most dangerous intersections:
- North Broadway / North Vancouver Ave. / Northeast I5 FWY-Broadway Ramp. Total crashes: 68
- Northeast Broadway/ Northeast Grand Ave. Total crashes: 68
- North Broadway / North Williams Ave. Total crashes: 62
*Police stats are violent crimes only. Both police and fire stats represent totals for five years
Prev
Next
#23
Madison South
Calls for police: 1,380
Fire incidents: 112
City's most dangerous intersections:
- Northeast 82nd Ave. / Northeast Sandy Blvd. Total crashes: 57
(photo courtesy of Neighborhood Notes)
*Police stats are violent crimes only. Both police and fire stats represent totals for five years
Prev
Next
#22
Richmond
Calls for police: 2,272
Fire incidents: 117
City's most dangerous intersections:
- Southeast Cesar E. Chavez Blvd./ Southeast Powell Blvd. Total crashes: 104
- Southeast 50th Ave./ Southeast Foster Rd./ Southeast Powell Blvd. Total crashes: 53
*Police stats are violent crimes only. Both police and fire stats represent totals for five years
Prev
Next
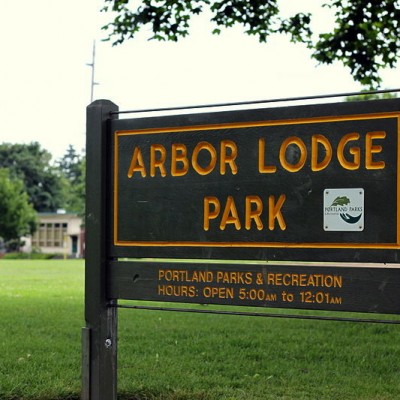
#21
Arbor Lodge
Calls for police: 1,843
Fire incidents: 81
City's most dangerous intersections:
- North Interstate Ave./ North Lombard St. Total crashes: 64
*Police stats are violent crimes only. Both police and fire stats represent totals for five years
Prev
Next
#20
Parkrose
Calls for police: 2,590
Fire incidents: 198
City's most dangerous intersections: none
*Police stats are violent crimes only. Both police and fire stats represent totals for five years
Prev
Next
#19
Northwest
Calls for police: 4,850
Fire incidents: 288
City's most dangerous intersections: none
*Police stats are violent crimes only. Both police and fire stats represent totals for five years
Prev
Next
#18
Mt. Scott-Arleta
Calls for police: 1,760
Fire incidents: 98
City's most dangerous intersections:
- Southeast 82nd Ave. / Southeast Foster Rd. Total crashes: 78
*Police stats are violent crimes only. Both police and fire stats represent totals for five years
Prev
Next
#17
Brentwood-Darlington
Calls for police: 2,038
Fire incidents: 159
City's most dangerous intersections: none
*Police stats are violent crimes only. Both police and fire stats represent totals for five years
Prev
Next
#16
Sellwood-Moreland
Calls for police: 2,243
Fire incidents: 132
City's most dangerous intersections:
- Southeast 13th Ave./ Southeast Tacoma St. Total crashes: 53
- Southeast Holgate Blvd./ Southeast McLoughlin Blvd. Total crashes: 35
*Police stats are violent crimes only. Both police and fire stats represent totals for five years
Prev
Next
#15
Eliot
Calls for police: 2,106
Fire incidents: 114
City's most dangerous intersections:
- North Broadway/ North Vancouver Ave./ Northeast I-5 FWY. Total crashes: 68
- Northeast Broadway/ Northeast Grand Ave. Total crashes: 68
- North Broadway/ North Williams Ave. Total crashes: 62
*Police stats are violent crimes only. Both police and fire stats represent totals for five years
Prev
Next
#14
St. Johns
Calls for police: 3,397
Fire incidents: 228
City's most dangerous intersections: none
*Police stats are violent crimes only. Both police and fire stats represent totals for five years
Prev
Next
#13
Portsmouth
Calls for police: 1,820
Fire incidents: 161
City's most dangerous intersections: none
*Police stats are violent crimes only. Both police and fire stats represent totals for five years
Prev
Next
#12
Pearl
Calls for police: 3,833
Fire incidents: 205
City's most dangerous intersections:
- Northwest Broadway/ Northwest Couch St. Total crashes: 82
*Police stats are violent crimes only. Both police and fire stats represent totals for five years
Prev
Next
#11
Kenton
Calls for police: 1,885
Fire incidents: 251
City's most dangerous intersections:
- North Interstate Ave./ North Lombard St. Total crashes: 64
*Police stats are violent crimes only. Both police and fire stats represent totals for five years
Prev
Next
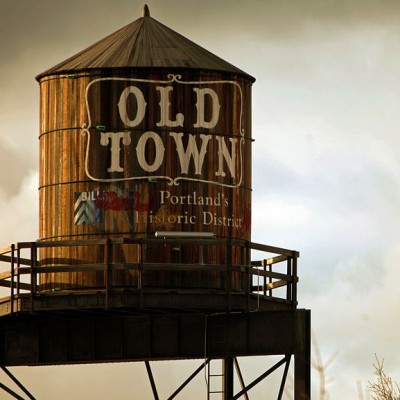
#10
China/Old Town
Calls for police: 3,258
Fire incidents: 60
City's most dangerous intersections:
- Northwest Broadway / Northwest Couch St. Total crashes: 82
*Police stats are violent crimes only. Both police and fire stats represent totals for five years
Prev
Next
#9
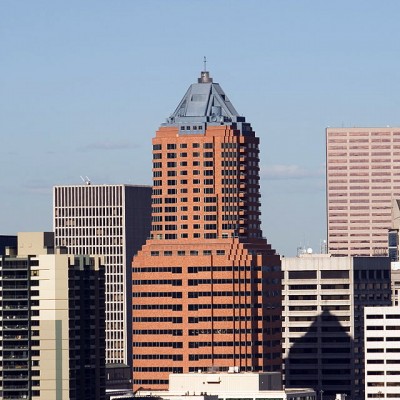
Downtown
Calls for police: 9,238
Fire incidents: 570
City's most dangerous intersections: none
*Police stats are violent crimes only. Both police and fire stats represent totals for five years
Prev
Next
#8
Cully
Calls for police: 2,787
Fire incidents: 177
City's most dangerous intersections:
- Northeast 82nd Ave./ Northeast Killingsworth St. Total crashes: 49
- Northeast Columbia Blvd. / Northeast I-205 Southbound / Columbia Blvd. Ramps. Total crashes: 84
- Northeast 82nd Ave. / Northeast Killingsworth St.Total crashes: 49
*Police stats are violent crimes only. Both police and fire stats represent totals for five years
_400_400_90.jpg)
Prev
Next
#7
Foster-Powell
Calls for police: 2,314
Fire incidents: 125
City's most dangerous intersections:
- Southeast 82nd Ave./ Holgate Blvd. Total crashes: 68
- Southeast 82nd Ave. / Southeast Powell Blvd. Total crashes: 171
- Southeast 82nd Ave. / Southeast Foster Rd. Total crashes: 78
*Police stats are violent crimes only. Both police and fire stats represent totals for five years
Prev
Next
#6
Mill Park
Calls for police: 2,108
Fire incidents: 171
City's most dangerous intersections:
- Southeast 122nd Ave./ Southeast Stark St. Total crashes: 156
- Southeast 112th Ave. / Southeast Division St. Total crashes: 71
- Southeast 122nd Ave. / Southeast Division St. Total crashes: 170
*Police stats are violent crimes only. Both police and fire stats represent totals for five years
Prev
Next
#5
Montavilla
Calls for police: 3,695
Fire incidents: 229
City's most dangerous intersections:
- Southeast 82nd Ave./ Southeast Division St. Total crashes: 102
- Northeast 82nd Ave./ Northeast Glisan Total crashes: 98
- East Burnside St./ Northeast 82nd Ave./ Southeast 82nd Ave. Total crashes: 62
- Southeast 92nd Ave./ Southeast Division St. Total crashes: 59
- Northeast Glisan St. / Northeast Glisan St. to I-205 Southbound Ramp. Total crashes: 51
- Southeast Division St. / Southeast Division St.-I205 FWY Ramp / Southeast I205 FW0Y. Total crashes: 55
*Police stats are violent crimes only. Both police and fire stats represent totals for five years
Prev
Next
#4
Centennial
Calls for police: 5,568
Fire incidents: 254
City's most dangerous intersections:
- Southeast 174th Ave./ Southeast Powell Blvd. Total crashes: 111
- Southeast 148th Ave./ Southeast Division St. Total crashes: 69
- Southeast 162nd Ave./ Southeast Division St. Total crashes: 92
- Southeast 174th Ave./ Southeast Division St. Total crashes: 56
- Southeast 162nd Ave. / Southeast Stark St. Total crashes: 55
*Police stats are violent crimes only. Both police and fire stats represent totals for five years
Prev
Next
#3
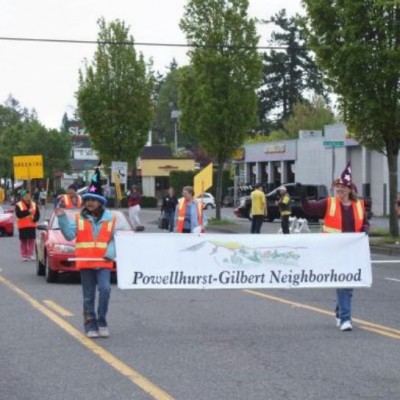
Powelhurst-Gilbert
Calls for police: 6,025
Fire incidents: 394
City's most dangerous intersections:
- Southeast 122nd Ave./ Southeast Division St. Total crashes: 170
- Southeast 122nd Ave./ Southeast Powell Blvd. Total crashes: 125
- Southeast 136 Ave./ Southeast Powell Blvd. Total crashes: 77
- Southeast 112th Ave./ Southeast Powell Blvd. Total crashes: 56
- Southeast 96th Dr./ Southeast Division St./ Southeast I-205 Northbound to Division. Total crashes: 79
- Southeast 122nd Ave./ Southeast Foster Rd. Total crashes: 53
- Southeast 82nd Ave. / Southeast Division St. Total crashes: 102
- Southeast 92nd Ave. / Southeast Powell Blvd. Total crashes: 99
- Southeast 92nd Ave. / Southeast Division St. Total crashes: 59
- Southeast Division St. / Southeast Division St-I205 Fwy Ramp / Southeast I205. Total crashes: 55
- Southeast 82nd Ave. / Southeast Powell Blvd. Total crashes: 171
- Southeast 112th Ave. / Southeast Division St. Total crashes: 71
*Police stats are violent crimes only. Both police and fire stats represent totals for five years
Prev
Next
#2
Lents
Calls for police: 6,973
Fire incidents: 419
City's most dangerous intersections:
- Southeast 92nd Ave./ Southeast Powell Blvd. Total crashes: 99
- Southeast 92nd Ave./ Southeast Holgate Blvd. Total crashes: 67
- Southeast 82nd Ave./ Southeast Foster Rd. Total crashes: 78
- Southeast 92nd Ave./ Southeast Foster Rd. Total crashes: 64
- Southeast Foster Rd./ Southeast 96th Ave./ Southeast Foster to I-205. Total crashes: 59
- Southeast 82nd Ave./ Southeast Flavel St. Total crashes: 49
- Southeast Foster Rd./ Southeast 94th Ave./ I-205 FWY. Total crashes: 49
- Southeast 82nd Ave. / Southeast Holgate Blvd. Total crashes: 68
- Southeast 82nd Ave. / Southeast Powell Blvd. Total crashes: 171
*Police stats are violent crimes only. Both police and fire stats represent totals for five years
**This slide previously included the intersection "Southesat Holgate Blvd./Southeast Mcloughlin Blv." which is not in the Lents neighborhood. It has since been removed**
Prev
Next
#1
Hazelwood
Calls for police: 10,136
Fire incidents: 483
City's most dangerous intersections:
- Northeast 122nd Ave./ Northeast Glisan St. Total crashes: 144
- Northeast 102nd Ave./ Northeast Glisan St. Total crashes: 110
- Northeast Glisan St./ Northeast Glisan St. to I-205 Northbound ramp. Total crashes: 87
- Southeast 96th Ave./ Southeast 99th Ave./ Southeast Washington St. Total crashes: 66
- Southeast 112th Ave./ Southeast Division St. Total crashes: 71
- Northeast Glisan St./ Northeast Glisan St. to I-205 Southbound ramp. Total crashes: 51
- Southeast 102nd Ave./ Southeast Stark St. Total crashes: 54
- Southeast Division St./Southeast Division St. to I-205 ramp. Total crashes: 55
- Northeast 99th Ave./ Northeast Glisan St. Total crashes: 53
- 122nd Ave. / Southeast Stark St. Total crashes: 156
- Southeast 136th Ave. / Southeast Powell Blvd. Total crashes: 77
- Southeast 148th Ave. / Southeast Stark St. Total crashes: 96
- Southeast 96th Dr. / Southeast Division St. / Southeast I-205 Northbound ramp to Division St. ramp. Total crashes: 79
- Northeast 102nd Ave. / Northeast Halsey St. Total crashes: 56
- Northeast 122nd Ave. / Northeast Halsey St. Total crashes: 99
*Police stats are violent crimes only. Both police and fire stats represent totals for five years
Related Articles
Enjoy this post? Share it with others.
Email to a friend
Permalink


_80_80_90_c1.jpg)


 Delivered Free Every
Follow us on Pinterest Google + Facebook Twitter See It Read It