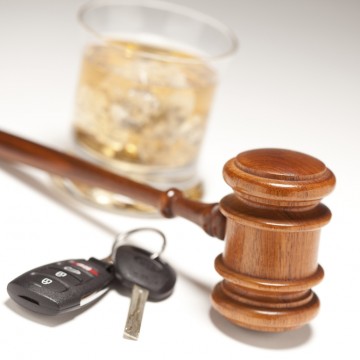
Critics: Washington County Judges Want to Extort Pleas from DUII suspects


 Email to a friend
Permalink
Email to a friend
Permalink
Monday, December 22, 2014
Shelby Sebens, GoLocalPDX Contributor
A new move by Washington County judges to take more DUII cases to trial may be unconstitutional, some local defense attorneys charge.
Washington County Circuit Court judges circulated an email in October stating that they would abandon a long-standing practice of using prescribed sentencing guidelines for DUII cases that go to trial.
The judges stated that only defendants who plead guilty before trial will be guaranteed sentences under the prescribed standards, such as two days in jail and 80 hours of community service for first time DUII. Those who go to trial would face the judges’ discretion and possibly harsher sentences.
Some defense lawyers believe the change will prompt suspects to plead guilty rather than face a trial with an uncertain punishment.
Critics say, while plea bargaining is an old legal traditional, this new move deliberately penalizes people for exercising their constitutional right to a trial.
“To me that’s pretty clearly unconstitutional under Oregon law,” Hillsboro Law Group attorney Grant Burton said. Burton said Oregon law prohibits suspects from being penalized for taking their cases to trial.
Washington County judges did not respond to requests for comment by publication time, but court officials said the District Attorney and the judges are trying to streamline the court system and improve efficiency.
Lawyers said some suspects have already been given harsher sentences since judges decided to change their sentencing standards.
“This is a bad thing for defendants who want to exercise their constitutional right to a trial,” Rob Harris of the Harris Law Firm said. “The fear of an enhanced sentenced always has a chilling effect.”
Pushing Pleas
Washington County is revamping its courts system to work more efficiently, Washington County Trial Court Administrator Richard Moellmer said. The county has traditionally had a high trial rate, according to court officials, and DUII cases often go to trial or at times plead on the day they are supposed to go to trial.
It’s clear judges and prosecutors would like to see more cases resolved and more suspects pleading guilty to get the courts moving more efficiently, officials say.
But defense lawyers argue the previous sentencing guidelines that were in place were fair.
Greg Scholl, director of Washington County’s Metropolitan Public Defender Services, said even if the judges are not attempting to keep suspects from going to trial, the change in policy has given a cause for concern.
“All defendants have the right to go to trial and should never fear a worse sentence after trial,” Scholl said. ”That fear does exist even if it is not the primary intent of the change the court is making.”
That said, how the judges decides to sentence suspects is not written in stone.
Court officials say, and even defense attorneys acknowledge, that under this new way of sentencing suspects could also get a lesser sentence if they go to trial because ultimately it will be up to the judge.
Defense attorneys say they think the judges' new sentencing practice will be challenged on a case by cases basis and that the whole process will likely face scrutiny.
"I would suspect that it’s ultimately not going to fly," Burton said. "I think it will be appealed and it will be overturned at some point."
Related Slideshow: Portland’s 35 Most Dangerous Neighborhoods
* Rankings have been adjusted since their original posting to better reflect all neighborhood boundaries that make contact with the city's most dangerous intersections.
Prev
Next
#35
Buckman-East
Calls for police: 1,714
Fire incidents: 162
City's most dangerous intersections: none
*Police stats are violent crimes only. Both police and fire stats represent totals for five years
Prev
Next
#34
Overlook
Calls for police: 1,792
Fire incidents: 139
City's most dangerous intersections: none
*Police stats are violent crimes only. Both police and fire stats represent totals for five years
Prev
Next
#33
King
Calls for police: 1,431
Fire incidents: 115
City's most dangerous intersections:
- Northeast Killingsworth St./ Northeast Martin Luther King Jr. Blvd. Total crashes: 57
*Police stats are violent crimes only. Both police and fire stats represent totals for five years
Prev
Next
#32
Buckman-West
Calls for police: 2,547
Fire incidents: 213
City's most dangerous intersections: none
*Police stats are violent crimes only. Both police and fire stats represent totals for five years
Prev
Next
#31
Kerns
Calls for police: 1,853
Fire incidents: 165
City's most dangerous intersections: none
*Police stats are violent crimes only. Both police and fire stats represent totals for five years
Prev
Next
#30
Hosford-Abernethy
Calls for police: 2,248
Fire incidents: 126
City's most dangerous intersections:
- Southeast 7th Ave./ Southeast Powell Blvd. Total crashes: 114
*Police stats are violent crimes only. Both police and fire stats represent totals for five years
Prev
Next
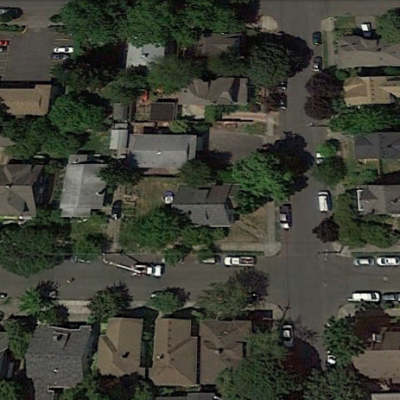
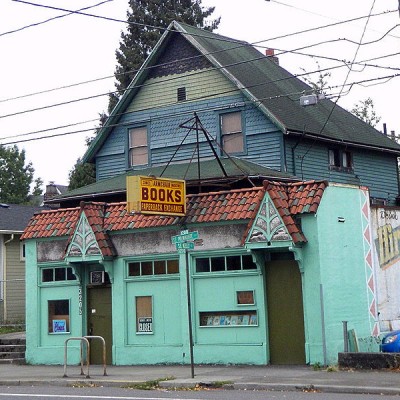
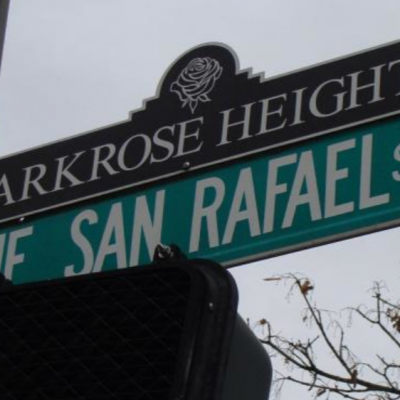
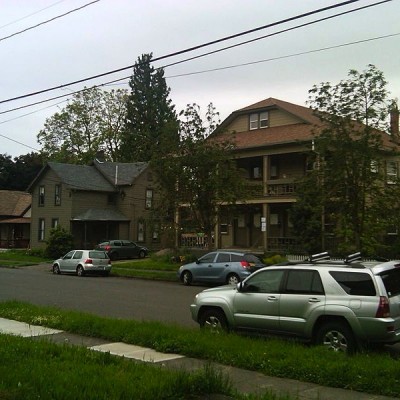
#29
Parkrose Heights
Calls for police: 1,064
Fire incidents: 86
City's most dangerous intersections:
- Northeast 122nd Ave./ Northeast Halsey St. Total crashes: 99
- Northeast 102nd Ave./ Northeast Halsey St. Total crashes: 56
*Police stats are violent crimes only. Both police and fire stats represent totals for five years
Prev
Next
#28
Creston-Kenilworth
Calls for police: 1,750
Fire incidents: 133
City's most dangerous intersections:
- Southeast Cesar E Chavez Blvd. / Southeast Powell Blvd.Total crashes: 104
- Southeast 50th Ave. / Southeast Foster Rd. / Southeast Powell Blvd. Total crashes: 53
*Police stats are violent crimes only. Both police and fire stats represent totals for five years
Prev
Next
#27
Hayden Island
Calls for police: 2,043
Fire incidents: 136
City's most dangerous intersections: none
*Police stats are violent crimes only. Both police and fire stats represent totals for five years
Prev
Next
#26
Wilkes
Calls for police: 1,269
Fire incidents: 102
City's most dangerous intersections: none
*Police stats are violent crimes only. Both police and fire stats represent totals for five years
Prev
Next
#25
Pleasant Valley
Calls for police: 1,102
Fire incidents: 89
City's most dangerous intersections:
- Southeast 174th Ave./ Southeast Powell Blvd. Total crashes: 111
- Southeast 122nd Ave. / Southeast Foster Rd. Total crashes: 53
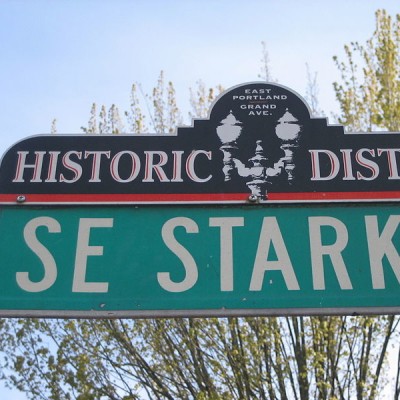
- Southeast 148th Ave. / Southeast Stark St. Total crashes: 96
*Police stats are violent crimes only. Both police and fire stats represent totals for five years
Prev
Next
#24
Lloyd
Calls for police: 4851
Fire incidents: 187
City's most dangerous intersections:
- North Broadway / North Vancouver Ave. / Northeast I5 FWY-Broadway Ramp. Total crashes: 68
- Northeast Broadway/ Northeast Grand Ave. Total crashes: 68
- North Broadway / North Williams Ave. Total crashes: 62
*Police stats are violent crimes only. Both police and fire stats represent totals for five years
Prev
Next
#23
Madison South
Calls for police: 1,380
Fire incidents: 112
City's most dangerous intersections:
- Northeast 82nd Ave. / Northeast Sandy Blvd. Total crashes: 57
(photo courtesy of Neighborhood Notes)
*Police stats are violent crimes only. Both police and fire stats represent totals for five years
Prev
Next
#22
Richmond
Calls for police: 2,272
Fire incidents: 117
City's most dangerous intersections:
- Southeast Cesar E. Chavez Blvd./ Southeast Powell Blvd. Total crashes: 104
- Southeast 50th Ave./ Southeast Foster Rd./ Southeast Powell Blvd. Total crashes: 53
*Police stats are violent crimes only. Both police and fire stats represent totals for five years
Prev
Next
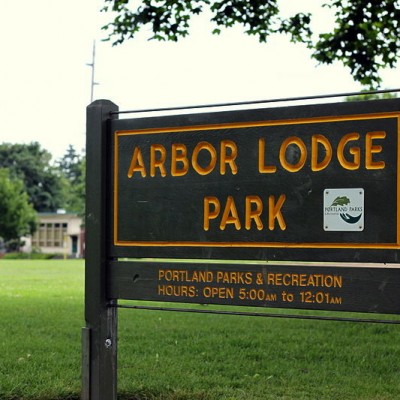
#21
Arbor Lodge
Calls for police: 1,843
Fire incidents: 81
City's most dangerous intersections:
- North Interstate Ave./ North Lombard St. Total crashes: 64
*Police stats are violent crimes only. Both police and fire stats represent totals for five years
Prev
Next
#20
Parkrose
Calls for police: 2,590
Fire incidents: 198
City's most dangerous intersections: none
*Police stats are violent crimes only. Both police and fire stats represent totals for five years
Prev
Next
#19
Northwest
Calls for police: 4,850
Fire incidents: 288
City's most dangerous intersections: none
*Police stats are violent crimes only. Both police and fire stats represent totals for five years
Prev
Next
#18
Mt. Scott-Arleta
Calls for police: 1,760
Fire incidents: 98
City's most dangerous intersections:
- Southeast 82nd Ave. / Southeast Foster Rd. Total crashes: 78
*Police stats are violent crimes only. Both police and fire stats represent totals for five years
Prev
Next
#17
Brentwood-Darlington
Calls for police: 2,038
Fire incidents: 159
City's most dangerous intersections: none
*Police stats are violent crimes only. Both police and fire stats represent totals for five years
Prev
Next
#16
Sellwood-Moreland
Calls for police: 2,243
Fire incidents: 132
City's most dangerous intersections:
- Southeast 13th Ave./ Southeast Tacoma St. Total crashes: 53
- Southeast Holgate Blvd./ Southeast McLoughlin Blvd. Total crashes: 35
*Police stats are violent crimes only. Both police and fire stats represent totals for five years
Prev
Next
#15
Eliot
Calls for police: 2,106
Fire incidents: 114
City's most dangerous intersections:
- North Broadway/ North Vancouver Ave./ Northeast I-5 FWY. Total crashes: 68
- Northeast Broadway/ Northeast Grand Ave. Total crashes: 68
- North Broadway/ North Williams Ave. Total crashes: 62
*Police stats are violent crimes only. Both police and fire stats represent totals for five years
Prev
Next
#14
St. Johns
Calls for police: 3,397
Fire incidents: 228
City's most dangerous intersections: none
*Police stats are violent crimes only. Both police and fire stats represent totals for five years
Prev
Next
#13
Portsmouth
Calls for police: 1,820
Fire incidents: 161
City's most dangerous intersections: none
*Police stats are violent crimes only. Both police and fire stats represent totals for five years
Prev
Next
#12
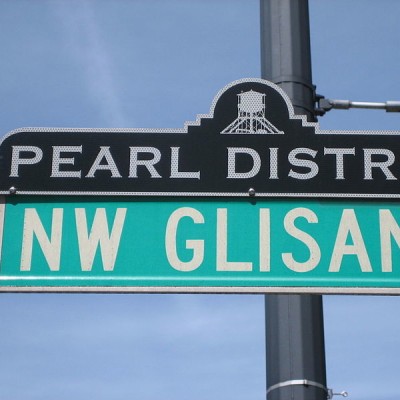
Pearl
Calls for police: 3,833
Fire incidents: 205
City's most dangerous intersections:
- Northwest Broadway/ Northwest Couch St. Total crashes: 82
*Police stats are violent crimes only. Both police and fire stats represent totals for five years
Prev
Next
#11
Kenton
Calls for police: 1,885
Fire incidents: 251
City's most dangerous intersections:
- North Interstate Ave./ North Lombard St. Total crashes: 64
*Police stats are violent crimes only. Both police and fire stats represent totals for five years
Prev
Next
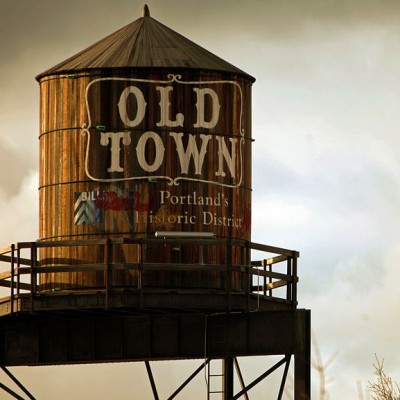
#10
China/Old Town
Calls for police: 3,258
Fire incidents: 60
City's most dangerous intersections:
- Northwest Broadway / Northwest Couch St. Total crashes: 82
*Police stats are violent crimes only. Both police and fire stats represent totals for five years
Prev
Next
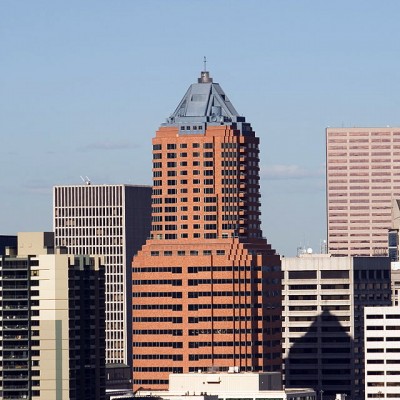
#9
Downtown
Calls for police: 9,238
Fire incidents: 570
City's most dangerous intersections: none
*Police stats are violent crimes only. Both police and fire stats represent totals for five years
Prev
Next
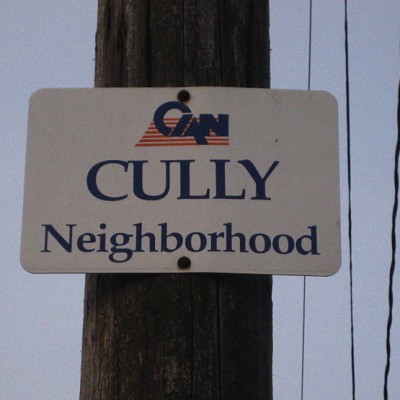
#8
Cully
Calls for police: 2,787
Fire incidents: 177
City's most dangerous intersections:
- Northeast 82nd Ave./ Northeast Killingsworth St. Total crashes: 49
- Northeast Columbia Blvd. / Northeast I-205 Southbound / Columbia Blvd. Ramps. Total crashes: 84
- Northeast 82nd Ave. / Northeast Killingsworth St.Total crashes: 49
*Police stats are violent crimes only. Both police and fire stats represent totals for five years
_400_400_90.jpg)
Prev
Next
#7
Foster-Powell
Calls for police: 2,314
Fire incidents: 125
City's most dangerous intersections:
- Southeast 82nd Ave./ Holgate Blvd. Total crashes: 68
- Southeast 82nd Ave. / Southeast Powell Blvd. Total crashes: 171
- Southeast 82nd Ave. / Southeast Foster Rd. Total crashes: 78
*Police stats are violent crimes only. Both police and fire stats represent totals for five years
Prev
Next
#6
Mill Park
Calls for police: 2,108
Fire incidents: 171
City's most dangerous intersections:
- Southeast 122nd Ave./ Southeast Stark St. Total crashes: 156
- Southeast 112th Ave. / Southeast Division St. Total crashes: 71
- Southeast 122nd Ave. / Southeast Division St. Total crashes: 170
*Police stats are violent crimes only. Both police and fire stats represent totals for five years
Prev
Next
#5
Montavilla
Calls for police: 3,695
Fire incidents: 229
City's most dangerous intersections:
- Southeast 82nd Ave./ Southeast Division St. Total crashes: 102
- Northeast 82nd Ave./ Northeast Glisan Total crashes: 98
- East Burnside St./ Northeast 82nd Ave./ Southeast 82nd Ave. Total crashes: 62
- Southeast 92nd Ave./ Southeast Division St. Total crashes: 59
- Northeast Glisan St. / Northeast Glisan St. to I-205 Southbound Ramp. Total crashes: 51
- Southeast Division St. / Southeast Division St.-I205 FWY Ramp / Southeast I205 FW0Y. Total crashes: 55
*Police stats are violent crimes only. Both police and fire stats represent totals for five years
Prev
Next
#4
Centennial
Calls for police: 5,568
Fire incidents: 254
City's most dangerous intersections:
- Southeast 174th Ave./ Southeast Powell Blvd. Total crashes: 111
- Southeast 148th Ave./ Southeast Division St. Total crashes: 69
- Southeast 162nd Ave./ Southeast Division St. Total crashes: 92
- Southeast 174th Ave./ Southeast Division St. Total crashes: 56
- Southeast 162nd Ave. / Southeast Stark St. Total crashes: 55
*Police stats are violent crimes only. Both police and fire stats represent totals for five years
Prev
Next
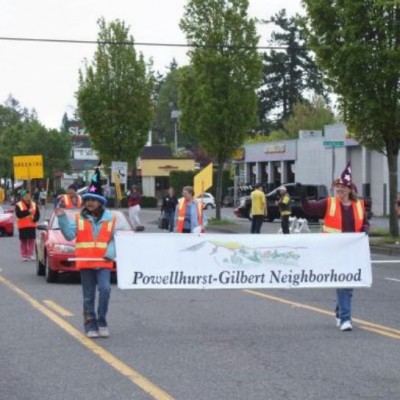
#3
Powelhurst-Gilbert
Calls for police: 6,025
Fire incidents: 394
City's most dangerous intersections:
- Southeast 122nd Ave./ Southeast Division St. Total crashes: 170
- Southeast 122nd Ave./ Southeast Powell Blvd. Total crashes: 125
- Southeast 136 Ave./ Southeast Powell Blvd. Total crashes: 77
- Southeast 112th Ave./ Southeast Powell Blvd. Total crashes: 56
- Southeast 96th Dr./ Southeast Division St./ Southeast I-205 Northbound to Division. Total crashes: 79
- Southeast 122nd Ave./ Southeast Foster Rd. Total crashes: 53
- Southeast 82nd Ave. / Southeast Division St. Total crashes: 102
- Southeast 92nd Ave. / Southeast Powell Blvd. Total crashes: 99
- Southeast 92nd Ave. / Southeast Division St. Total crashes: 59
- Southeast Division St. / Southeast Division St-I205 Fwy Ramp / Southeast I205. Total crashes: 55
- Southeast 82nd Ave. / Southeast Powell Blvd. Total crashes: 171
- Southeast 112th Ave. / Southeast Division St. Total crashes: 71
*Police stats are violent crimes only. Both police and fire stats represent totals for five years
Prev
Next
#2
Lents
Calls for police: 6,973
Fire incidents: 419
City's most dangerous intersections:
- Southeast 92nd Ave./ Southeast Powell Blvd. Total crashes: 99
- Southeast 92nd Ave./ Southeast Holgate Blvd. Total crashes: 67
- Southeast 82nd Ave./ Southeast Foster Rd. Total crashes: 78
- Southeast 92nd Ave./ Southeast Foster Rd. Total crashes: 64
- Southeast Foster Rd./ Southeast 96th Ave./ Southeast Foster to I-205. Total crashes: 59
- Southeast 82nd Ave./ Southeast Flavel St. Total crashes: 49
- Southeast Foster Rd./ Southeast 94th Ave./ I-205 FWY. Total crashes: 49
- Southeast 82nd Ave. / Southeast Holgate Blvd. Total crashes: 68
- Southeast 82nd Ave. / Southeast Powell Blvd. Total crashes: 171
*Police stats are violent crimes only. Both police and fire stats represent totals for five years
**This slide previously included the intersection "Southesat Holgate Blvd./Southeast Mcloughlin Blv." which is not in the Lents neighborhood. It has since been removed**
Prev
Next
#1
Hazelwood
Calls for police: 10,136
Fire incidents: 483
City's most dangerous intersections:
- Northeast 122nd Ave./ Northeast Glisan St. Total crashes: 144
- Northeast 102nd Ave./ Northeast Glisan St. Total crashes: 110
- Northeast Glisan St./ Northeast Glisan St. to I-205 Northbound ramp. Total crashes: 87
- Southeast 96th Ave./ Southeast 99th Ave./ Southeast Washington St. Total crashes: 66
- Southeast 112th Ave./ Southeast Division St. Total crashes: 71
- Northeast Glisan St./ Northeast Glisan St. to I-205 Southbound ramp. Total crashes: 51
- Southeast 102nd Ave./ Southeast Stark St. Total crashes: 54
- Southeast Division St./Southeast Division St. to I-205 ramp. Total crashes: 55
- Northeast 99th Ave./ Northeast Glisan St. Total crashes: 53
- 122nd Ave. / Southeast Stark St. Total crashes: 156
- Southeast 136th Ave. / Southeast Powell Blvd. Total crashes: 77
- Southeast 148th Ave. / Southeast Stark St. Total crashes: 96
- Southeast 96th Dr. / Southeast Division St. / Southeast I-205 Northbound ramp to Division St. ramp. Total crashes: 79
- Northeast 102nd Ave. / Northeast Halsey St. Total crashes: 56
- Northeast 122nd Ave. / Northeast Halsey St. Total crashes: 99
*Police stats are violent crimes only. Both police and fire stats represent totals for five years
Related Articles
Enjoy this post? Share it with others.
Email to a friend
Permalink


_80_80_90_c1.jpg)


 Delivered Free Every
Follow us on Pinterest Google + Facebook Twitter See It Read It