After $5 Million Deal, Critics Ask if Portland Schools Misled Voters


 Email to a friend
Permalink
Email to a friend
Permalink
Monday, September 08, 2014
Cornelius Swart and Shelby Sebens, GoLocalPDX
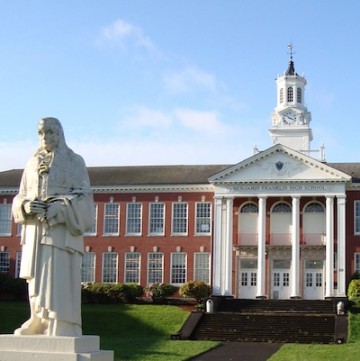
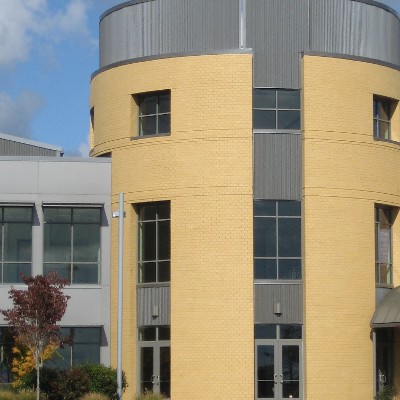
Franklin High School will be remodeled using money from a 2012 voter-approved bond. Credit: PPS
Questions are being raised about whether or not the
Portland Schools District misled the public after the district agreed to transfer $5 million in public bond money to the city of Portland for transportation projects.
Some critics are crying foul, stating the projects were not part of the bond that voters approved.
In June, the Portland School District and the City of Portland entered into an intergovernmental agreement to transfer $5.2 million out of a $482 million bond approved by voters, so that the city could “to identify, prioritize, and fund mutually-agreed upon transportation safety improvements,” according to city documents.
The money comes from a schools construction bond that was approved by voters in November 2012. The bond language that went before voters said the money would be used to renovate Franklin, Grant and Roosevelt high schools and Faubion PreK-8 school, as well as other school building improvement projects such as fixing roofs, converting boilers and upgrading science classrooms.
There is no mention, however, of transportation projects.
The spending of bond money can be a slippery slope, according to experts. In the past, PPS has even had to refund money from a bond after the district failed to adequately outline to the public how the money would be spent.
Bonding of public projects
Economist Eric Fruits has been a critic of past PPS bond measures. In 2011 he was involved in a grass-roots campaign against an earlier construction bond the district floated.
Fruits doesn’t mind the district and city working together on projects that keep kids safe, but claimed the district has gone outside the bounds of what it contracted with the public to do.
“When you earmark construction bond money, the money should be used on school property,” said Fruits. “If you use the money outside of PPS property, that's a problem.”
Earlier such missteps led to financial problems.
In 1998 the district got into a financial bind when an internal audit concluded that PPS had not dealt clearly with the voters when it spent $8 million from a $196.7 million from a 1995 construction bond to build Forest Park Elementary School and renovations at PPS headquarters on North Dixon Street.
In that case, construction of the new school in Northwest Portland and the renovations were included in the language put before voters, but they were absent from the district’s legal documents, used to guide spending, according to media reports at the time.
In that case, district Superintendent Ben Canada ordered a halt to the renovations at the district’s Dixon Street headquarters mid-project. The district committed to repaying the $8 million back through its general operating funds, much to the chagrin of teachers negotiating for pay rises at the time.
Oregon State Rep. Lew Frederick was PPS spokesman in 1998 when news of the district’s mismanagement went public.
He said he was surprised by PPS’s latest spending moves.
“That’s a lot of money,” Frederick said. “I would have expected some mention of [transportation projects] somewhere. I would think they would be clear about that.
"You don’t want to say to the public, ‘Please give us money. We’ll figure out later where to spend it.’”
Good deal for the taxpayer, officials say

PPS agreed in June to hand over $5 million to the city's Safe Routes to Schools program. Credit: City of Portland
Both the city and the district said they’ve been working for years on the agreement and that the public will benefit from the deal.
The money will go into the city’s Safe Routes to Schools program. The program prioritizes pedestrian and bicycle improvements on city surface roads and sidewalks.
The city said the agreement is similar to deals it’s made with other school districts in Portland.
“There are transportation safety needs at many schools across the city, in PPS and in east Portland,” said Dylan Rivera, Portland Bureau of Transportation spokesman. “The city is partnering with all school districts to improve transportation near schools, especially for biking and walking access for families.”
The $5 million can only be spent in areas around the 63 of PPS’s 85 schools targeted by the bond. Much of the money will be spent on major construction projects around the high schools slated for renovations.
PPS and the city said the agreement will make it easier and cheaper to renovate schools.
The city of Portland often requires that large construction projects include upgrades to the surrounding transportation infrastructure, such as roads, sidewalks and traffic signals.
The city agreed to eliminate a number of permitting hoops for the district and streamlined the development process for construction as part of the deal, Rivera said.
Considering the scale of the bond construction happening across the city, the deal actually lowers the cost to the district, PPS spokesman John Isaacs said.
“It might normally have cost us $10 to $20 million more,” Issacs said. “It’s a good deal for the community.
"It saves the taxpayer money and the city gets flexibility in the use of the funds.”
A matter of public trust
It’s the flexibility part that municipal attorney Edward McGlone cautions against.
McGlone advises cities throughout Clackamas and Marion counties on municipal issues including levies and bonds.

Public bond dollars are often legally flexible. Credit: Eyeliam {cropped}, cc
In his view there is plenty of legal grey area within which the district can operate. But that isn't necessarily a good thing, he added.
“There are legitimate interests in getting students to and from school safely,” McClone said.
The district can use bond money to pay for costs that are a normal part of their construction projects, he said.
“But if I was the property owner (paying for the bond) I would be concerned," McClone added. "I’d say, ‘Wait, this isn’t what you promised to do."
McGlone was senior assistant counsel for Clackamas County for a decade. In his experience, public entities get in hot water less for crossing legal lines than when there’s a public perception that a line has been crossed.
“More often than not, it’s about whether or not (public entities) are keeping the trust with the public,” McGlone said. “I think the bulk of it comes down to that.”
Related Slideshow: Slideshow: Top Portland Metro High Schools
GoLocalPDX has ranked the top high schools in the metro area using a method developed in Babson College, Mass. High schools were ranked based on complete data available.
Prev
Next
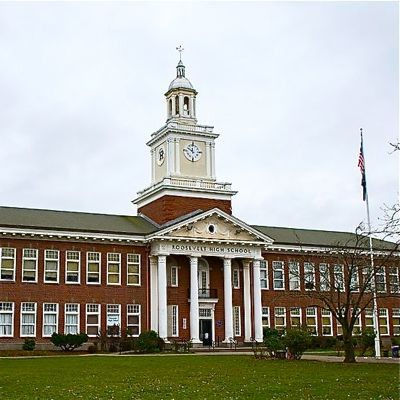
#46
Roosevelt High
Multnomah County
Enrollment: 771
Economically disadvantaged: 76%
Met or exceeded reading standards: 78.1%
Met or exceeded math standards: 59%
Met or exceeded writing standards: 47.9%
Met or exceeded science standards: 19.5%
Four year graduation rate: 69.9%
Photo Credit: Visitor7 - Own work. Licensed under CC BY-SA 3.0 via Wikimedia Commons.

Prev
Next
#45
Madison High
Multnomah County
Enrollment: 1025
Economically disadvantaged: 68%
Met or exceeded reading standards: 72.2%
Met or exceeded math standards: 64.9%
Met or exceeded writing standards: 51.3%
Met or exceeded science standards: 37.4%
Four year graduation rate: 71%
Photo Credit: kamera kızı via Compfight cc
Prev
Next
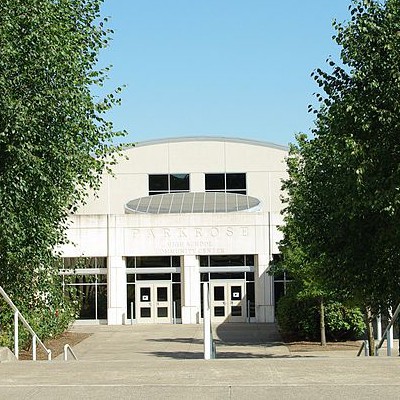
#44
Parkrose High
Multnomah County
Enrollment: 951
Economically disadvantaged: 68%
Met or exceeded reading standards: 83.5%
Met or exceeded math standards: 65.3%
Met or exceeded writing standards: 53.6%
Met or exceeded science standards: 52.6%
Four year graduation rate: 69%
Photo Credit: M.O. Stevens - Own work. Licensed under CC BY-SA 3.0 via Wikimedia Commons
Prev
Next
#43
David Douglas High
Multnomah County
Enrollment: 3027
Economically disadvantaged: 74%
Met or exceeded reading standards: 78.2%
Met or exceeded math standards: 61.9%
Met or exceeded writing standards: 52.2%
Met or exceeded science standards: 52.9%
Four year graduation rate: 71.6%

Prev
Next
#42
Alliance High
Multnomah County
Enrollment: 224
Economically disadvantaged: 58%
Met or exceeded reading standards: 73.5%
Met or exceeded math standards: 42.5%
Met or exceeded writing standards: 33.3%
Met or exceeded science standards: 43.2%
Four year graduation rate: 20.9%
Photo Credit: @RunRockPrincess viaCompfight cc
Prev
Next
#41
Hillsboro High
Washington County
Enrollment: 1315
Economically disadvantaged: 55%
Met or exceeded reading standards: 77.3%
Met or exceeded math standards: 68.1%
Met or exceeded writing standards: 52.6%
Met or exceeded science standards: 38.4%
Four year graduation rate: 71.6%
Photo Credit: M.O. Stevens - via Wikimedia Commons.
Prev
Next
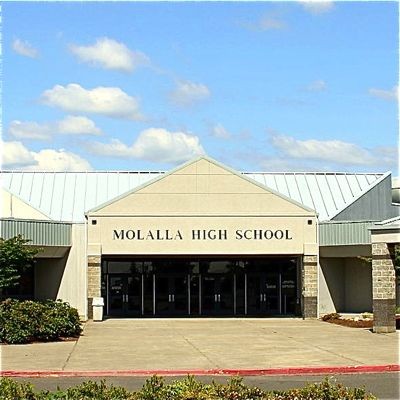
#40
Molalla High
Clackamas County
Enrollment: 739
Economically disadvantaged: 38%
Met or exceeded reading standards: 86.7%
Met or exceeded math standards: 73.5%
Met or exceeded writing standards: 49.1%
Met or exceeded science standards: 63.4%
Four year graduation rate: 75.2%
Photo Credit: Tedder - Own work. Licensed under CC BY 3.0 via Wikimedia Commons.

Prev
Next
#39
Reynolds High
Multnomah County
Enrollment: 2468
Economically disadvantaged: 65%
Met or exceeded reading standards: 84.6%
Met or exceeded math standards: 67.5%
Met or exceeded writing standards: 43.5%
Met or exceeded science standards: 58.9%
Four year graduation rate: 62.7%
Photo Credit:

Prev
Next
#38
Milwaukie High
Clackamas County
Enrollment: 1053
Economically disadvantaged: 57%
Met or exceeded reading standards: 77.1%
Met or exceeded math standards: 64.2%
Met or exceeded writing standards: 51.2%
Met or exceeded science standards: 67.8%
Four year graduation rate: 70.9%
Photo Credit: Pingveno - Own work. Licensed under CC BY 3.0 via Wikimedia Commons.

Prev
Next
#37
Centennial High
Multnomah County
Enrollment: 1665
Economically disadvantaged: 57%
Met or exceeded reading standards: 86.6%
Met or exceeded math standards: 78.9%
Met or exceeded writing standards: 62.7%
Met or exceeded science standards: 42.3%
Four year graduation rate: 78.7%
Photo Credit: naosuke ii via Compfight cc
Prev
Next
#36
Gresham High
Multnomah County
Enrollment: 1667
Economically disadvantaged: 52%
Met or exceeded reading standards: 83.9%
Met or exceeded math standards: 67.4%
Met or exceeded writing standards: 58.7%
Met or exceeded science standards: 59.7%
Four year graduation rate: 72.5%
Photo Credit: M.O. Stevens - Own work. Licensed under CC BY-SA 3.0 via Wikimedia Commons.
Prev
Next
#35
Benson Polytechnic High
Multnomah County
Enrollment: 819
Economically disadvantaged: 68%
Met or exceeded reading standards: 87.1%
Met or exceeded math standards: 75.9%
Met or exceeded writing standards: 40.8%
Met or exceeded science standards: 84%
Four year graduation rate: 82.2%
Photo Credit: EncMstr - Own work. Licensed under CC BY-SA 3.0 via Wikimedia Commons.
Prev
Next
#34
Liberty High
Washington County
Enrollment: 1386
Economically disadvantaged: 46%
Met or exceeded reading standards: 89.8%
Met or exceeded math standards: 76%
Met or exceeded writing standards: 53.3%
Met or exceeded science standards: 65.8%
Four year graduation rate: 79.6%
Photo Credit: Aboutmovies

Prev
Next
#33
Aloha High
Washington County
Enrollment: 1962
Economically disadvantaged: 61%
Met or exceeded reading standards: 82.7%
Met or exceeded math standards: 64.5%
Met or exceeded writing standards: 62.2%
Met or exceeded science standards: 60.2%
Four year graduation rate: 72.2%

Prev
Next
#32
Sandy High
Clackamas County
Enrollment: 1286
Economically disadvantaged: 36%
Met or exceeded reading standards: 86.4%
Met or exceeded math standards: 69%
Met or exceeded writing standards: 59%
Met or exceeded science standards: 71.6%
Four year graduation rate: 76%
Prev
Next
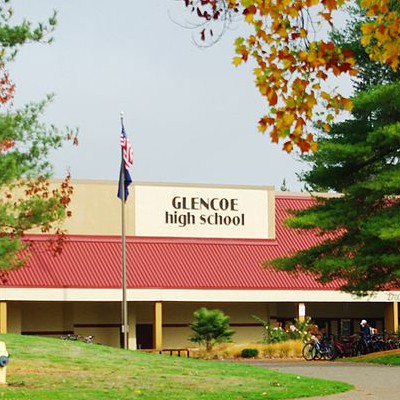
#31
Glencoe High
Washington County
Enrollment: 1601
Economically disadvantaged: 39%
Met or exceeded reading standards: 88.3%
Met or exceeded math standards: 70.5%
Met or exceeded writing standards: 58.4%
Met or exceeded science standards: 69.9%
Four year graduation rate: 77.1%

Prev
Next
#30
Banks High
Washington County
Enrollment: 384
Economically disadvantaged: 23%
Met or exceeded reading standards: 91.5%
Met or exceeded math standards: 79.8%
Met or exceeded writing standards: 57.4%
Met or exceeded science standards: 81.1%
Four year graduation rate: 80.6%
Photo Credit: frankjuarez via Compfight cc

Prev
Next
#29
Clackamas Middle College
Clackamas County
Enrollment: 290
Economically disadvantaged: 28%
Met or exceeded reading standards: 91.4%
Met or exceeded math standards: 76.3%
Met or exceeded writing standards: 59.3%
Met or exceeded science standards: 78%
Four year graduation rate: 32.6%
Photo Credit: Photo Credit: Maya83 via Compfight cc

Prev
Next
#28
Estacada High
Clackamas County
Enrollment: 589
Economically disadvantaged: 46%
Met or exceeded reading standards: 89.9%
Met or exceeded math standards: 77.7%
Met or exceeded writing standards: 59%
Met or exceeded science standards: 66.4%
Four year graduation rate: 71.8%

Prev
Next
#27
Putnam High
Clackamas County
Enrollment: 1196
Economically disadvantaged: 39%
Met or exceeded reading standards: 88.6%
Met or exceeded math standards: 73.4%
Met or exceeded writing standards: 69.9%
Met or exceeded science standards: 59.3%
Four year graduation rate: 75.7%
Prev
Next
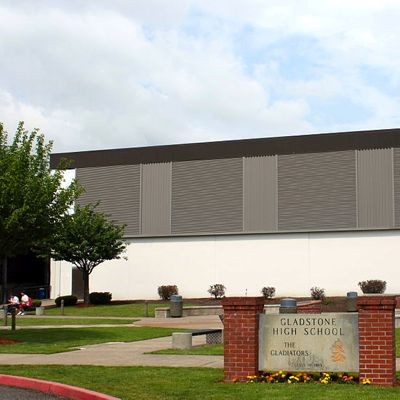
#26
Gladstone High
Clackamas County
Enrollment: 677
Economically disadvantaged: 40%
Met or exceeded reading standards: 88.7%
Met or exceeded math standards: 77.5%
Met or exceeded writing standards: 66%
Met or exceeded science standards: 82.2%
Four year graduation rate: 78.9%
Prev
Next
#25
Franklin High
Multnomah County
Enrollment: 1387
Economically disadvantaged: 56%
Met or exceeded reading standards: 89.2%
Met or exceeded math standards: 77.7%
Met or exceeded writing standards: 68.1%
Met or exceeded science standards: 59.8%
Four year graduation rate: 78.4%
_400_400_90.JPG)
Prev
Next
#24
Century High School
Washington County
Enrollment: 1608
Economically disadvantaged: 43%
Met or exceeded reading standards: 87.8%
Met or exceeded math standards: 78.6%
Met or exceeded writing standards: 62.7%
Met or exceeded science standards: 72.9%
Four year graduation rate: 84.8%
Prev
Next
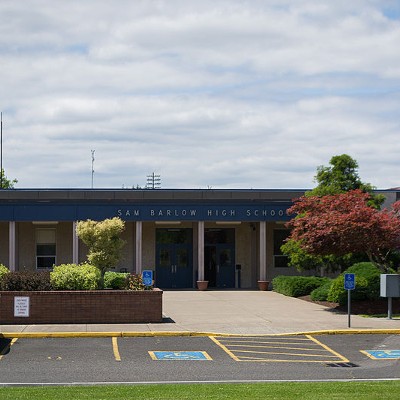
#23
Sam Barlow High School
Multnomah County
Enrollment: 1651
Economically disadvantaged: 38%
Met or exceeded reading standards: 84.5%
Met or exceeded math standards: 78.4%
Met or exceeded writing standards: 68.8%
Met or exceeded science standards: 76.7%
Four year graduation rate: 81.8%
Prev
Next
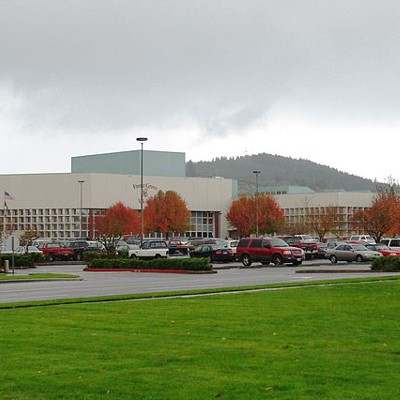
#22
Forest Grove High School
Washington County
Enrollment: 1779
Economically disadvantaged: 59%
Met or exceeded reading standards: 89.4%
Met or exceeded math standards: 85.7%
Met or exceeded writing standards: 66.6%
Met or exceeded science standards: 61.1%
Four year graduation rate: 72.5%

Prev
Next
#21
Canby High
Clackamas County
Enrollment: 1481
Economically disadvantaged: 32%
Met or exceeded reading standards: 87.3%
Met or exceeded math standards: 84%
Met or exceeded writing standards: 71.5%
Met or exceeded science standards: 61.6%
Four year graduation rate: 82.5%
Prev
Next
#20
Oregon City Senior High
Clackamas County
Enrollment: 2117
Economically disadvantaged: 34%
Met or exceeded reading standards: 97.5%
Met or exceeded math standards: 90.8%
Met or exceeded writing standards: 63%
Met or exceeded science standards: 76.7%
Four year graduation rate: 83%
Prev
Next
#19
Beaverton High
Washington County
Enrollment: 1588
Economically disadvantaged: 43%
Met or exceeded reading standards: 90%
Met or exceeded math standards: 76.7%
Met or exceeded writing standards: 70.7%
Met or exceeded science standards: 65.4%
Four year graduation rate: 74.2%
Prev
Next
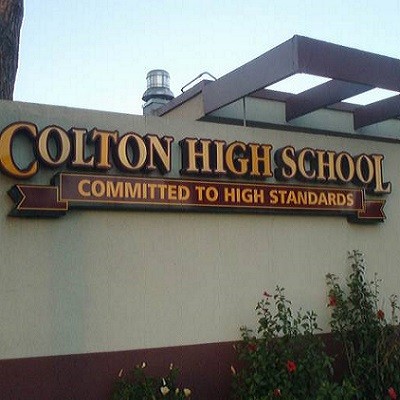
#18
Colton High
Clackamas County
Enrollment: 215
Economically disadvantaged: 28%
Met or exceeded reading standards: 90%
Met or exceeded math standards: 76%
Met or exceeded writing standards: 68%
Met or exceeded science standards: 85.1%
Four year graduation rate: 95.2%

Prev
Next
#17
Tualatin High
Washington County
Enrollment: 1714
Economically disadvantaged: 27%
Met or exceeded reading standards: 92.2%
Met or exceeded math standards: 76.7%
Met or exceeded writing standards: 62.9%
Met or exceeded science standards: 71.4%
Four year graduation rate: 84.4%

Prev
Next
#16
Tigard High
Washington County
Enrollment: 1835
Economically disadvantaged: 32%
Met or exceeded reading standards: 92.7%
Met or exceeded math standards: 83.5%
Met or exceeded writing standards: 64.5%
Met or exceeded science standards: 67.7%
Four year graduation rate: 80.8%
Photo Credit: Aboutmovies - Own work. Licensed under Public domain via Wikimedia Commons.
Prev
Next
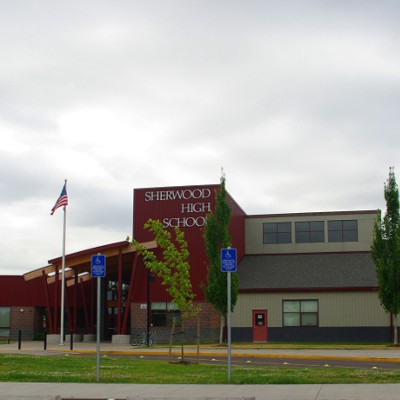
#15
Sherwood High
Washington County
Enrollment: 1469
Economically disadvantaged: 15%
Met or exceeded reading standards: 97.5%
Met or exceeded math standards: 85.8%
Met or exceeded writing standards: 62.2%
Met or exceeded science standards: 84.8%
Four year graduation rate: 91.3%
Prev
Next
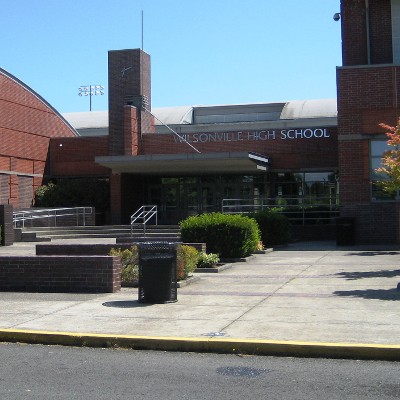
#14.
Wilsonville High
Clackamas County
Enrollment: 1093
Economically disadvantaged: 24%
Met or exceeded reading standards: 92.5%
Met or exceeded math standards: 74.1%
Met or exceeded writing standards: 74.2%
Met or exceeded science standards: 71.3%
Four year graduation rate: 85%
_399_400_90.JPG)
Prev
Next
#13
Clackamas High
Clackamas County
Enrollment: 2230
Economically disadvantaged: 29%
Met or exceeded reading standards: 91.7%
Met or exceeded math standards: 85.7%
Met or exceeded writing standards: 80.5%
Met or exceeded science standards: 74.2%
Four year graduation rate: 85.5%
Prev
Next
#12
Southridge High
Washington County
Enrollment: 1722
Economically disadvantaged: 27%
Met or exceeded reading standards: 91.5%
Met or exceeded math standards: 80.4%
Met or exceeded writing standards: 66.3%
Met or exceeded science standards: 68.9%
Four year graduation rate: 88.5%
Prev
Next
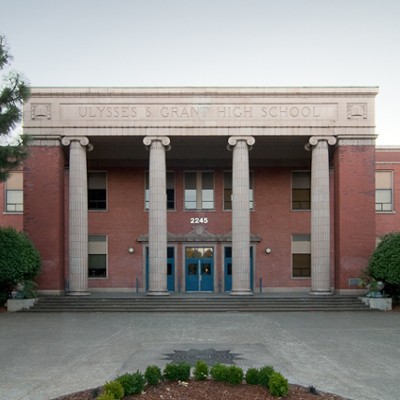
#11
Grant High
Multnomah County
Enrollment: 1489
Economically disadvantaged: 24%
Met or exceeded reading standards: 92.6%
Met or exceeded math standards: 83.3%
Met or exceeded writing standards: 70.3%
Met or exceeded science standards: 66.4%
Four year graduation rate: 84.3%
Prev
Next
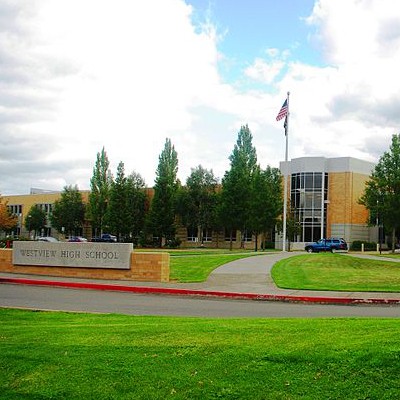
#10
Westview High
Washington County
Enrollment: 2418
Economically disadvantaged: 33%
Met or exceeded reading standards: 92.2%
Met or exceeded math standards: 81.8%
Met or exceeded writing standards: 75.4%
Met or exceeded science standards: 70.3%
Four year graduation rate: 80.1%
Prev
Next
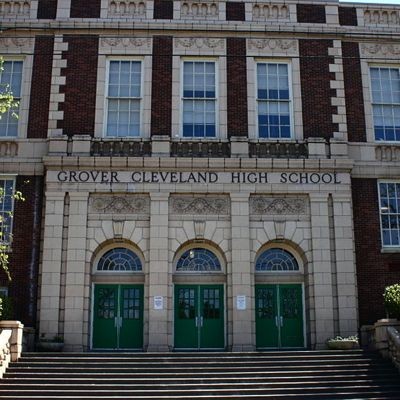
#9
Cleveland High
Multnomah County
Enrollment: 1457
Economically disadvantaged: 29%
Met or exceeded reading standards: 92.6%
Met or exceeded math standards: 80.2%
Met or exceeded writing standards: 81.4%
Met or exceeded science standards: 59.7%
Four year graduation rate: 76.2%
Photo Credit: Tedder - Own work. Licensed under CC BY 3.0 via Wikimedia Commons.

Prev
Next
#8
Sunset High
Washington County
Enrollment: 1942
Economically disadvantaged: 29%
Met or exceeded reading standards: 94.7%
Met or exceeded math standards: 83.3%
Met or exceeded writing standards: 76.8%
Met or exceeded science standards: 79.7%
Four year graduation rate: 81.4%

Prev
Next
#7
Wilson High
Multnomah County
Enrollment: 1185
Economically disadvantaged: 22%
Met or exceeded reading standards: 91.8%
Met or exceeded math standards: 80.4%
Met or exceeded writing standards: 82.8%
Met or exceeded science standards: 63.8%
Four year graduation rate: 84.4%
Prev
Next
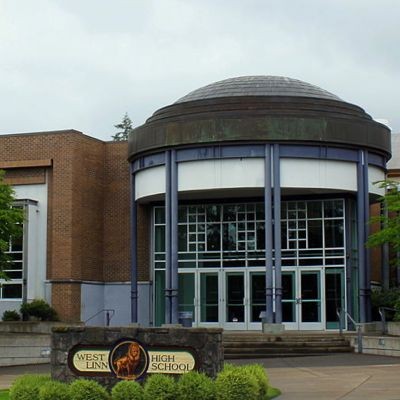
#6.
West Linn High
Clackamas County
Enrollment: 1514
Economically disadvantaged: 10%
Met or exceeded reading standards: 97.5%
Met or exceeded math standards: 87.9%
Met or exceeded writing standards: 85.8%
Met or exceeded science standards: 83.2%
Four year graduation rate: 93.2%

Prev
Next
#5
Riverdale High
Multnomah County
Enrollment: 242
Economically disadvantaged: <6%*
Met or exceeded reading standards: 97.5%
Met or exceeded math standards: 89.8%
Met or exceeded writing standards: 74.6%
Met or exceeded science standards: 74.6%
Four year graduation rate: 94.2%
* For less than six percent an asterisk is used on Oregon Department of Education data.

Prev
Next
#4
School of Science & Technology
Washington County
Enrollment: 167
Economically disadvantaged: 20%
Met or exceeded reading standards: 97.5%
Met or exceeded math standards: 97.5%
Met or exceeded writing standards: 86%
Met or exceeded science standards: 63.9%
Four year graduation rate: 81.1%
Photo Credit: crazytales562 via Compfightcc
Prev
Next
#3
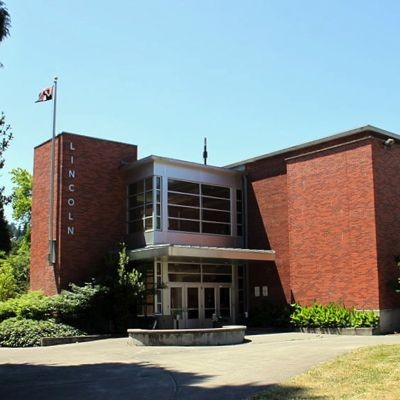
Lincoln High
Multnomah County
Enrollment: 1471
Economically disadvantaged: 12%
Met or exceeded reading standards: 92.5%
Met or exceeded math standards: 85.3%
Met or exceeded writing standards: 88.1%
Met or exceeded science standards: 79.9%
Four year graduation rate: 89.3%
Prev
Next
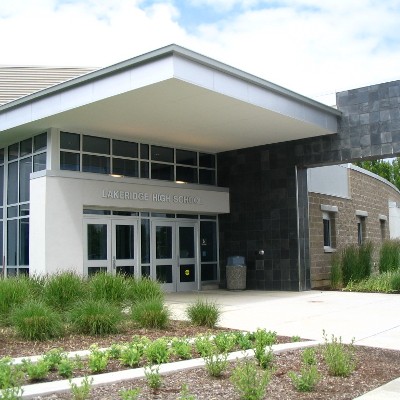
#2
Lakeridge High
Clackamas County
Enrollment: 1078
Economically disadvantaged: 8%
Met or exceeded reading standards: 97.5%
Met or exceeded math standards: 93.9%
Met or exceeded writing standards: 91.8%
Met or exceeded science standards: 92.1%
Four year graduation rate: 89.9%
Prev
Next
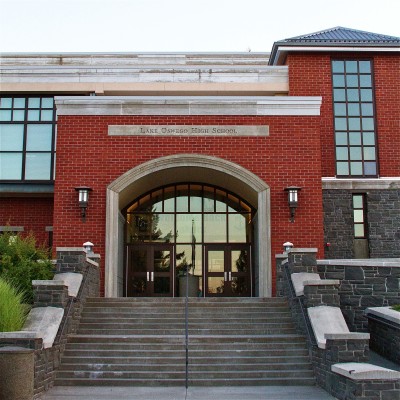
#1
Lake Oswego Senior High
Clackamas County
Enrollment: 1224
Economically disadvantaged: 6%
Met or exceeded reading standards: 97.5%
Met or exceeded math standards: 92.4%
Met or exceeded writing standards: 89.1%
Met or exceeded science standards: 87.7%
Four year graduation rate: 89.5%
Photo Credit: KristinNador via Compfight cc
Related Articles
Enjoy this post? Share it with others.
Email to a friend
Permalink


_80_80_90_c1.JPG)


_80_80_90_c1.JPG)


Follow us on Pinterest Google + Facebook Twitter See It Read It