Portland Then/Now: Northwest Broadway Near Union Station


Thursday, June 18, 2015
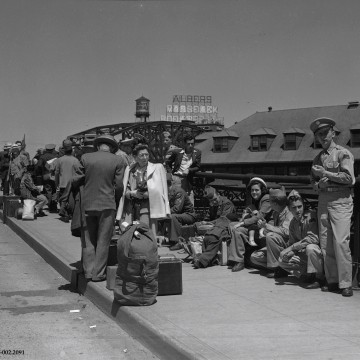
Northwest Broadway near Union Station. Les Ordeman photo of 1948 flood refugees, 1948: City of Portland Archives, A2004-002.2091
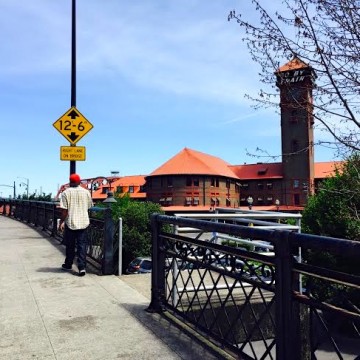
Northwest Broadway near Union Station. Photo by Byron Beck.
THEN: This photograph was taken in 1948 by Oregon Journal photographer Les Ordemen on Northwest Broadway near Union Station and Broadway Bridge. In the background you can see the site of the old Alber Mills.
The people lined up on the ramp are refugees displaced from the infamous Vanport flood in 1948. According to ohs.org,“on Memorial Day in 1948, the Columbia River, swirling fifteen feet above normal, punched a hole in a railroad embankment that served as a dike, starting a flood that would leave 18,000 people homeless and alter race relations in Portland forever.”
OHS continues, “for eight years, the embankment had kept the river out of a newly developed 648-acre complex called Vanport, then the largest public housing project in the United States…At the height of the war in 1944, close to 40,000 people lived in Vanport, including 6,000 African Americans, three times as many as had lived in all of Portland two years before.”
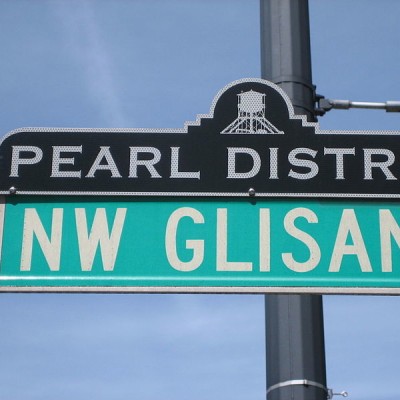
NOW: The ramp to the Broadway Bridge is still in the same spot in 2015, as is Union Station but much of the area around it has dramatically changed with the advent of the Pearl District and the MAX Light Rail line. It also is not far from both the relatively new Bud Clark Commons (with 130 studio units of low-income housing, a 90-bed men’s transitional shelter and Day Center) as well as the brand new home of the Pacific Northwest College of Art. Alber Mills is stil there but was transformed in 1989 into an office building.
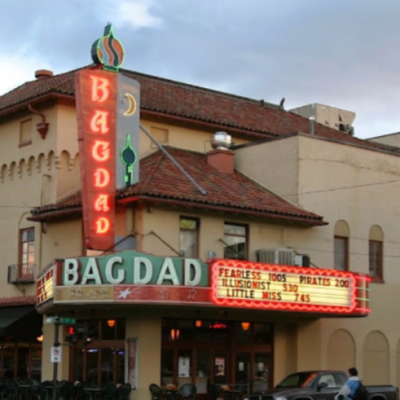
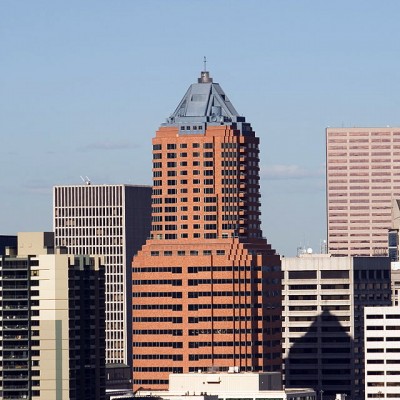
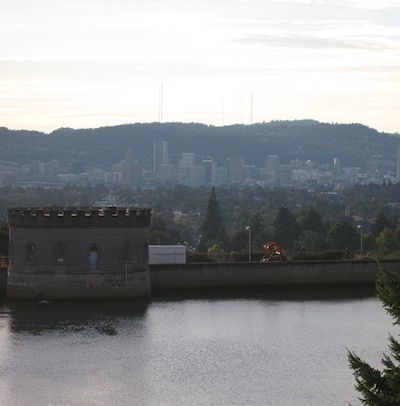
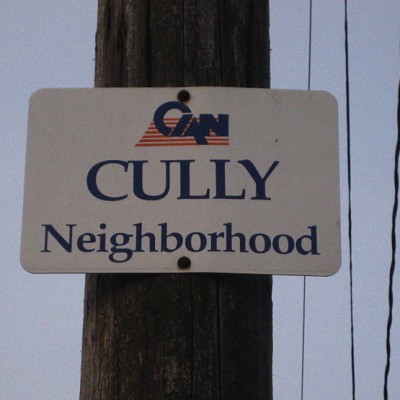
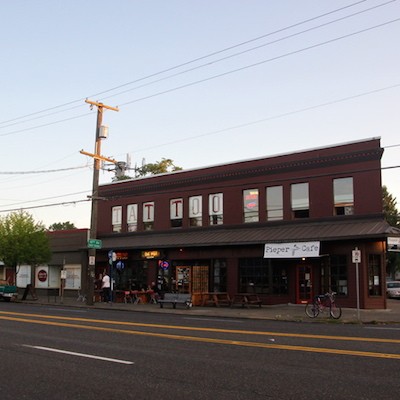
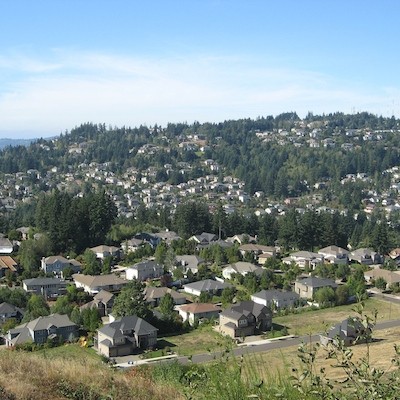
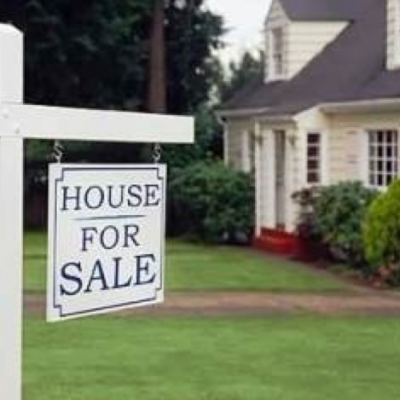
Related Slideshow: Portland’s 20 Hottest Neighborhoods for Real Estate
What are Portland’s hottest neighborhoods for real estate? The 20 neighborhoods below are ranked by the number of sold homes over the last 90 days. The information, along with the median list price and median price per square foot, comes from the real estate company Redfin. The population is from 2010 census data.
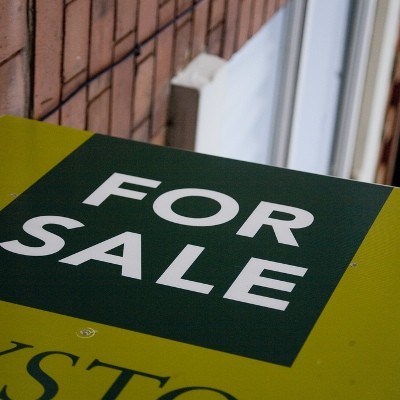
The sale to list percentage, also from Redfin, is the final selling price over what the listed price was, to show how close sellers came to their asking price. In cases where it is over 100 percent, the seller got more than then listed price.
Find out what the hottest real estate neighborhoods in Portland are:
_400_400_90.jpg)

#20 (tied)
#19 (tied)
#18 (tied)
#17
#16 (tied)
#15 (tied)
#14 (tied)_80_80_90_c1.jpg)
#13 (tied)
#12 (tied)
#11 (tied)
#10
#9
#8
#7
#6
#5
#4
#3
#2
#1
Related Articles
- Portland Then/Now: Southwest Fourth Ave. & Yamhill St.
- Portland Then/Now: Southwest Fourth Avenue & Madison Street
- Portland Then/Now: Southwest Fourth Avenue and Morrison Street
- Portland Then/Now: Southwest Park Ave. and Yamhill Street
- Portland Then/Now: Southwest Fifth Avenue
- Portland Then/Now: Southwest College Street & Sixth Avenue
- Portland Then/Now: Southwest Broadway and Morrison Street
- Portland Then/Now: Southwest Broadway and Taylor Street
- Portland Then/Now: Southwest Broadway and Washington Street
- Portland Then/Now: Southwest Park Avenue & Taylor Street
- Portland Then/Now: Southwest Second Ave. & Burnside St.
- Portland Then/Now: Tom McCall Waterfront Park
- Portland Then/Now: Union Station
- Portland Then/Now: West Burnside St. and Southwest 10th Ave.
- Portland Then/Now: West Burnside St. and Southwest 18th Ave.
- Portland Then/Now: The Portland Hotel/Pioneer Courthouse Square
- Portland Then/Now: The Corner of Southwest 11th Avenue & Morrison Street
- Portland Then/Now: Southwest Third Ave. and Burnside St.
- Portland Then/Now: SW Park Ave. & Yamhill & Taylor St.
- Portland Then/Now: SW Washington St. & Downtown Waterfront
- Portland Then/Now: Southwest Broadway and Alder Street
- Portland Then/Now: Southwest 2nd Ave. and Yamhill Street
- Portland Then/Now: Multnomah County Central Library
- Portland Then/Now: North Lombard St. and Portsmouth Ave.
- Portland Then/Now: Northwest 12th Avenue and Lovejoy Street
- Portland Then/Now: Northwest Broadway and Everett Street
- Portland Then/Now: Mill Ends Park
- Portland Then/Now: Hawthorne Bridge
- Portland Then/Now: Broadway and North Larabee St.
- Portland Then/Now: Downtown Portland’s Keller Fountain Park
- Portland Then/Now: East Burnside and 8th Avenue
- Portland Then/Now: Northwest Couch Street and Third Avenue
- Portland Then/Now: NW Couch St. & Second Ave.
- Portland Then/Now: South End of Burnside Bridge
- Portland Then/Now: Southwest 10th Ave. and Yamhill Street
- Portland Then/Now: Southwest 11th Ave. and Morrison St.
- Portland Then/Now: SE 82nd Ave. Between Clinton & Division
- Portland Then/Now: Sandy Blvd. & Northeast 24th Ave.
- Portland Then/Now: Pioneer Courthouse Square
- Portland Then/Now: Portland City Hall
- Portland Then/Now: Portland State University & SW Park Ave.
- Portland Then/Now: Northwest Broadway Near Union Station


Follow us on Pinterest Google + Facebook Twitter See It Read It